本文由 AI(Trae Agent) 检索、整理并撰写,尚未经过人工逐条校对。所有数字均来自本文自带 R 代码的实际运行结果,代码、模拟数据生成器与结果文件都在文章目录中,可逐条复现。真实数据实验使用 10x Genomics 公开的 PBMC3k 数据集,其细胞类型标签由 marker 打分与 k-means 得到,不是金标准。文中引用均给出 DOI 或官方仓库,但请注意软件版本更新会使具体数值变化。
This article was researched and written by an AI system (Trae Agent) and has not been proofread line by line by a human. Every number below comes from an actual run of the R code shipped with the post (simulator, experiment scripts and result files are all in the post directory). The real-data section uses the public 10x Genomics PBMC3k dataset, where cell-type labels come from marker scoring plus k-means — not from a ground truth. References are given with DOIs or official repositories; exact numbers will drift as software versions change.
生成本文所用的提示词(压缩后) / Prompt used to generate this article (condensed)
Write a bilingual (paragraph-by-paragraph) long-form article on low-dimensional representations of cell state. Cover ten escalating questions: observed vs intrinsic dimension; what PCA, UMAP, diffusion maps, autoencoders and VAEs each learn; whether distances and directions are biologically meaningful; cross-modality alignment; whether latent interpolation simulates differentiation; what kind of representation supports perturbation prediction. Build one shared simulation (3,000 cells × 1,000 genes, branching trajectory, batch effects) and run eight R experiments, including a real public dataset. Produce at least twelve figures in a consistent style, four of them interactive. Show failures and counter-intuitive results; never tune the simulation so that a preferred method wins; every number must come from a real run.
1. 一个细胞究竟有多少维? / How Many Dimensions Does a Cell Have?
A cell, as we observe it, is a vector of roughly twenty thousand numbers. Single-cell RNA sequencing turns each cell into a column of counts: a gene is detected zero times, three times, or twelve hundred times. Stacking those columns gives a matrix \(X \in \mathbb{R}^{N \times G}\), with \(N\) cells (3,000 in the simulation below) and \(G\) genes (1,000).
The matrix looks extremely high-dimensional, but it does not fill the gene space evenly. Genes controlled by the same regulatory programme rise and fall together; the cell cycle makes one block oscillate; differentiation switches another block on or off. The consequence is that the region actually occupied by the data has far fewer effective degrees of freedom than\(G\).
这里必须区分三个概念,全文都会反复用到:
Three notions have to be kept apart, and the whole article depends on the distinction:
观测维度(observed dimension):矩阵的列数 \(G\),也就是我们测了多少个基因。 The number of columns\(G\): how many genes we measured.
内在维度(intrinsic dimension):数据云局部真正张成的维数 \(d^\*\),与坐标系无关。 The local dimension\(d^\*\) of the data cloud itself, independent of coordinates.
潜在维度(latent dimension):我们假设存在、并试图用模型估计的那几个变量 \(z \in \mathbb{R}^{d}\)。 The few variables\(z \in \mathbb{R}^{d}\) we assume to exist and try to estimate.
The three are not equal. \(d\) is a choice (a hyper-parameter), \(d^\*\) is a property of the data, and \(G\) is a property of the experiment. Most arguments about whether a dimensionality reduction is trustworthy eventually reduce to: how far is the estimated \(d\) from the true \(d^\*\)?
To answer that, we need to know \(d^\*\), which nobody knows for real data. So we start from a generative model in which cell \(i\) is controlled by three continuous factors — differentiation time \(t_i\), activation \(a_i\), and lineage choice \(b_i\):
Here \(s_i\) is a continuous branch coordinate. The important part is \(w(t)\): it is near zero early and rises to one after \(t \approx 0.58\). Two early cells on different branches are therefore indistinguishable in expression; the branch is not a label imposed at \(t=0\) but a direction that becomes visible as differentiation proceeds.
表达由负二项分布生成,均值由五个基因模块叠加而成:
Expression is drawn from a negative-binomial distribution whose mean is a sum of five gene modules:
\(f_g\) contains 140 monotone genes, 60 transiently pulsing genes, 120 branch genes, 120 activation genes and 60 cell-cycle genes; \(L_i\) is sequencing depth, \(\gamma\) is a batch shift and \(\theta_g\) sets overdispersion. In this system \(d^\* = 3\), and we know it.
Code
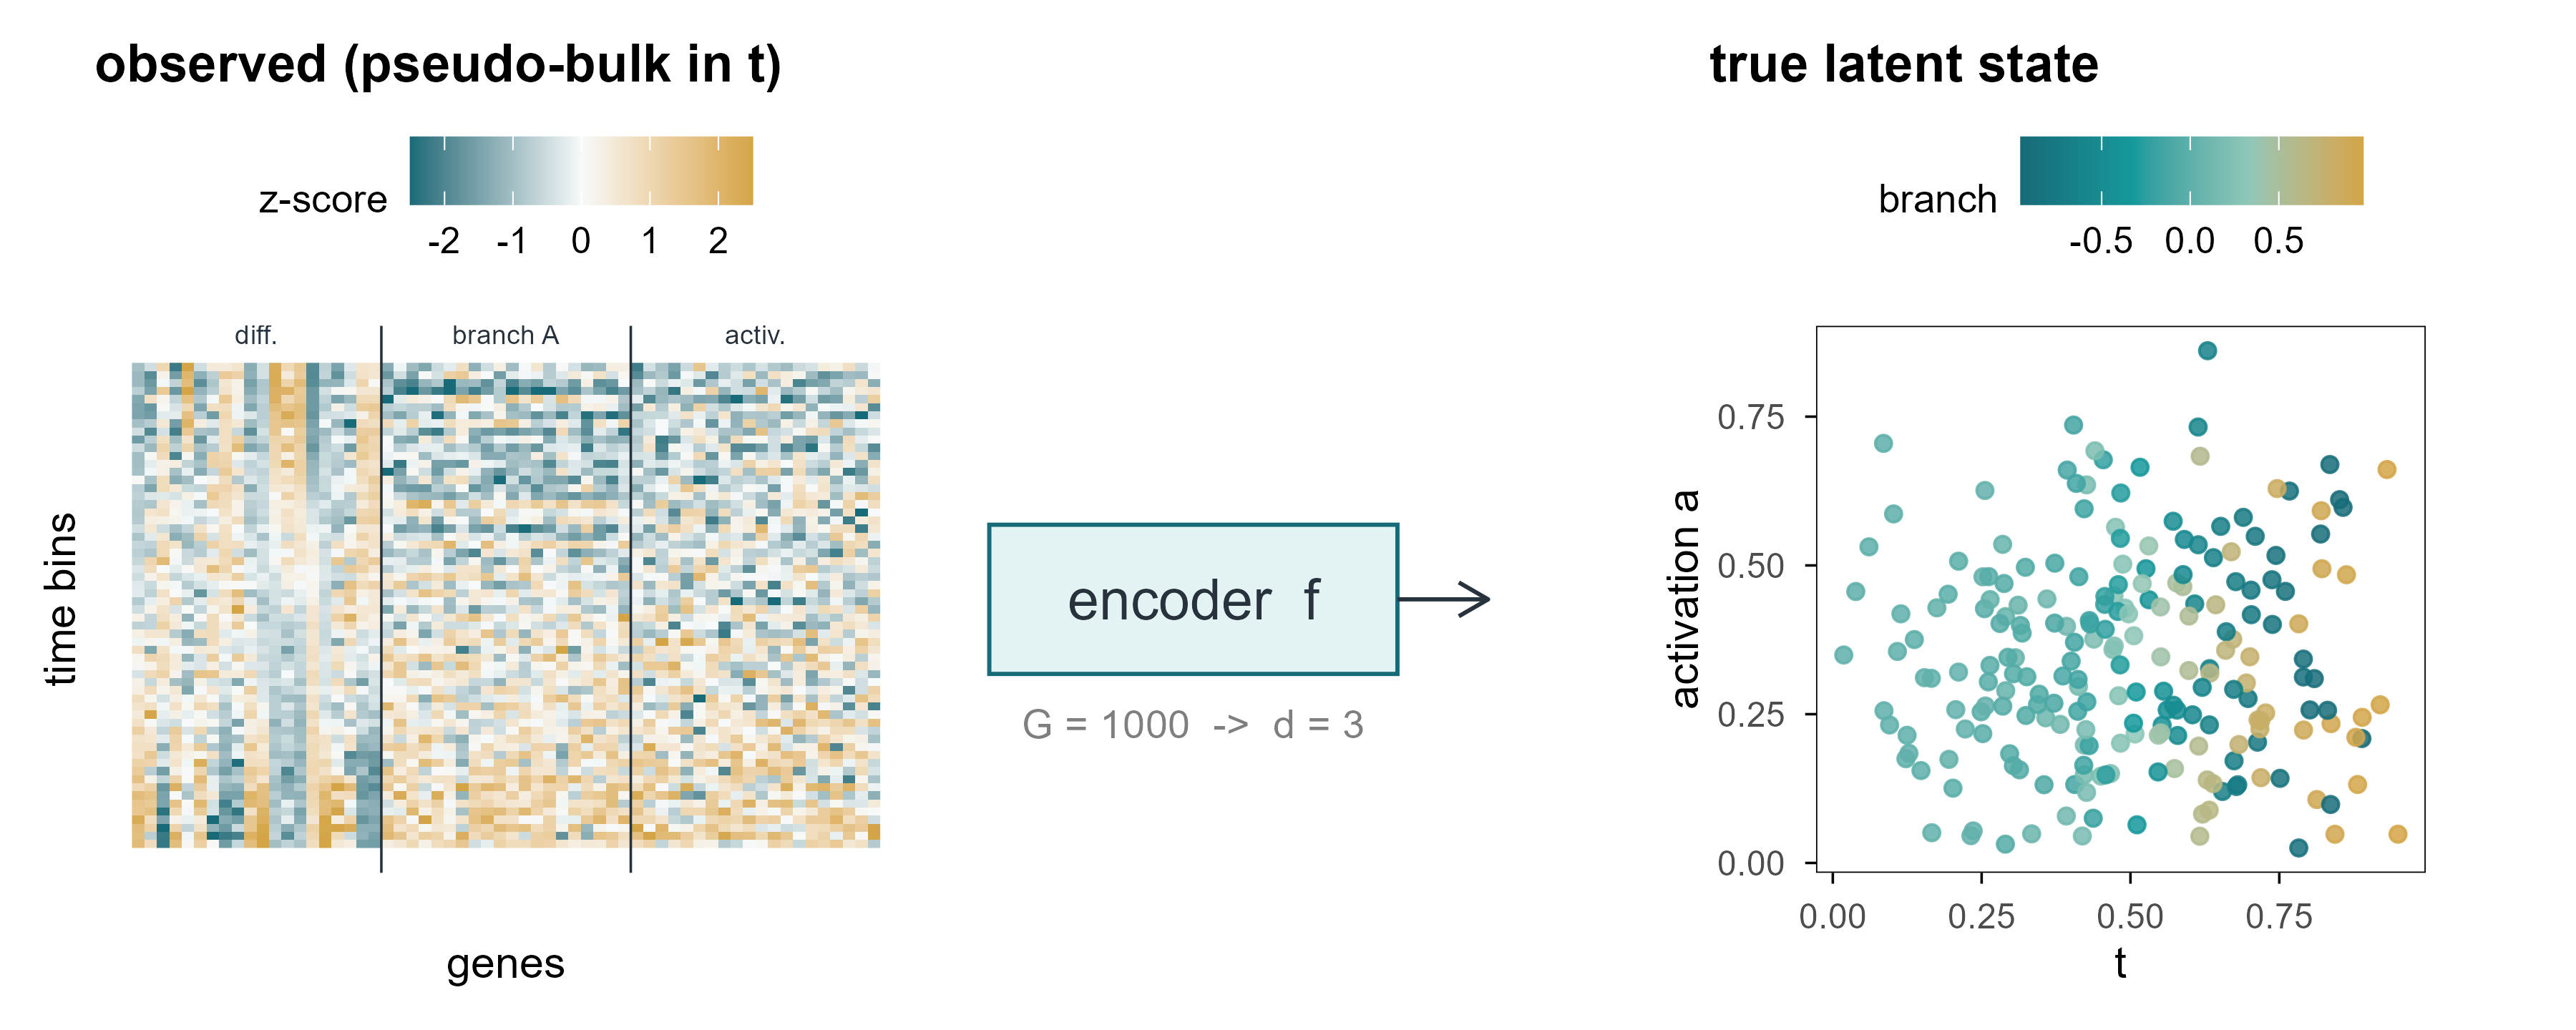
set.seed(1)sub_genes <-c(sim$modules$mono[1:20], sim$modules$branchA[1:20], sim$modules$activation[1:20])# pseudo-bulk in 60 bins of differentiation time: averaging reduces counting# noise so that the underlying modules become visibleLfull <-as.matrix(logcpm(sim$counts[, sub_genes], lib = Matrix::rowSums(sim$counts)))o <-order(sim$truth$t)Lfull <- Lfull[o, ]grp <-cut(seq_len(nrow(Lfull)), 60, labels =FALSE)Lbin <-rowsum(Lfull, grp) /as.vector(table(grp))Lbin <-scale(Lbin)lt <-tibble(cell =rep(seq_len(60), times =length(sub_genes)),gene =rep(seq_along(sub_genes), each =60),value =as.vector(Lbin),group =rep(c("differentiation", "branch A", "activation"), each =20*60),gene_lab =factor(gene))p_a <-ggplot(lt, aes(gene, cell, fill = value)) +geom_raster() +scale_fill_gradient2(low ="#176B78", mid ="#F7FAFA", high ="#D4A547",midpoint =0, limits =c(-2.5, 2.5), oob = scales::squish,name ="z-score") +geom_vline(xintercept =c(20.5, 40.5), colour = cell_pal[["ink"]], linewidth =0.3) +annotate("text", x =c(10.5, 30.5, 50.5), y =64, label =c("diff.", "branch A", "activ."),size =2.4, colour = cell_pal[["ink"]]) +coord_cartesian(ylim =c(0.5, 62)) +labs(x ="genes", y ="time bins", title ="observed (pseudo-bulk in t)") +theme(axis.text =element_blank(), axis.ticks =element_blank(),panel.border =element_blank())set.seed(1)sub_cells <-sample(nrow(sim$truth), 220)z <- sim$truth[sub_cells, ]p_c <-ggplot(z, aes(Z1, Z2, colour = Z3)) +geom_point(size =1.6, alpha =0.85) +scale_colour_t(name ="branch") +labs(x ="t", y ="activation a", title ="true latent state") +coord_fixed(ratio =1)p_b <-ggplot() +annotate("rect", xmin =0.05, xmax =0.95, ymin =0.35, ymax =0.65,fill ="#159A9C", alpha =0.12, colour ="#176B78") +annotate("text", x =0.5, y =0.5, label ="encoder f", size =5, colour ="#28323C") +annotate("segment", x =0.95, xend =1.15, y =0.5, yend =0.5,arrow =arrow(length =unit(3, "mm")), colour ="#28323C") +annotate("text", x =0.5, y =0.25, label ="G = 1000 -> d = 3", size =3.6, colour ="#7F7F7F") +coord_cartesian(xlim =c(0, 1.2), ylim =c(0, 1)) +theme_void()(p_a + p_b + p_c) +plot_layout(widths =c(1.1, 0.8, 1.1))
Figure 1: 图 1 从一千维观测到三个隐藏状态。左:3000 个细胞 × 1000 个基因的 log-CPM 子矩阵(仅画 60 个基因);中:编码器把每个细胞压成 3 维;右:模拟数据真实的潜在空间,颜色为分化进程 \(t\),形状为分支。 | Figure 1. From a thousand observed dimensions to three hidden states. Left: a log-CPM submatrix of 3,000 cells × 60 of the 1,000 genes. Middle: an encoder maps each cell to three numbers. Right: the simulated ground-truth latent space, coloured by differentiation time \(t\) with branch shown as shape.
1.2 内在维度可以估计,但噪声会骗人 / Intrinsic dimension can be estimated, and noise lies
The intuition: in \(d\) dimensions the neighbour distances grow roughly as \(r_j \propto j^{1/d}\), so the slope on a log scale is \(1/d\). Applying it to the simulation is revealing.
Code
id <- e1$id_estid$k10 <-round(id$k10, 1); id$k20 <-round(id$k20, 1)knitr::kable(id, col.names =c("数据 / data", "k = 10", "k = 20"),caption ="内在维度的极大似然估计($k$ 为近邻数)。 | Maximum-likelihood estimate of intrinsic dimension for different neighbour counts.")
Table 1: 内在维度的极大似然估计(\(k\) 为近邻数)。
内在维度的极大似然估计(\(k\) 为近邻数)。 | Maximum-likelihood estimate of intrinsic dimension for different neighbour counts.
数据 / data
k = 10
k = 20
observed, logCPM z-scored
100.0
87.2
observed, depth+batch corrected
113.0
97.5
noiseless expectation (log mu)
3.6
3.6
true factors (t, a, branch)
2.2
2.1
Intrinsic dimension estimates. The generative model has three continuous factors; noise inflates the observed estimate by more than an order of magnitude.
The noiseless expectation gives 3.6, close to the three designed factors. Add negative-binomial counting noise and the estimate jumps above 100. The estimator is not broken; this is distance concentration: in high dimensions all pairwise distances become similar, the ratios \(r_k/r_j\) approach one, their logs approach zero, and the reciprocal explodes.
That result is the first warning of the article: estimating “effective dimensionality” directly on single-cell data yields a number set by the noise level, not by biological degrees of freedom. Which is why every method below has to normalise and denoise before any claim about dimension is made.
Suppose we accept that the true state of a cell is set by a few variables. The relation between observation \(x\) and state \(z\) is then a two-stage map: an encoder compresses the observation into latent space, and a decoder maps the latent state back to observations.
In PCA, \(f_\theta\) is the linear projection \(z = V_d^\top (x - \bar x)\) and \(g_\phi\) is its transpose. In an autoencoder both are neural networks. In a VAE, \(f_\theta\) outputs not a point but a distribution \(q_\phi(z\mid x)\).
2.1 潜在变量不等于机制 / Latent variables are not mechanisms
There is a trap almost everyone falls into at first. A latent variable is a coordinate introduced to make the observed covariance structure simpler; it does not automatically correspond to a biological entity. One latent dimension may mix the cell cycle with sequencing depth; conversely, a well-defined mechanism (a transcription factor, say) may be split across two latent dimensions.
区分两种说法很重要:
Two claims must be distinguished:
表示性(representational):存在某个函数 \(f\),使得 \(z = f(x)\) 能重建 \(x\),并且在下游任务上有用。这是可检验的。 There exists a function\(f\) such that \(z=f(x)\) reconstructs \(x\) and is useful downstream. This is testable.
因果性(causal):改变 \(z_j\) 会导致 \(x\) 按某个方向变化,且这种变化在干预下稳定。这需要干预实验,单靠观测数据无法确立。 Changing\(z_j\) causes \(x\) to move in a specific direction, stably under intervention. This needs perturbation data; observational data alone cannot establish it.
后文第 9、10 章会反复回到这个区分:几乎所有「虚拟细胞」的宣传语,都偷偷把前者当成了后者。
Chapters 9 and 10 return to this distinction repeatedly: most “virtual cell” claims quietly substitute the first for the second.
3. PCA:寻找变化最大的方向 / PCA: Finding the Directions of Maximum Variance
Draw each cell as a point in \(G\)-dimensional space. PCA asks a disarmingly simple question: if only one direction can be kept, along which direction is the projection most spread out? The answer is the leading eigenvector of the covariance matrix. The second direction maximises the remaining variance subject to being orthogonal to the first, and so on.
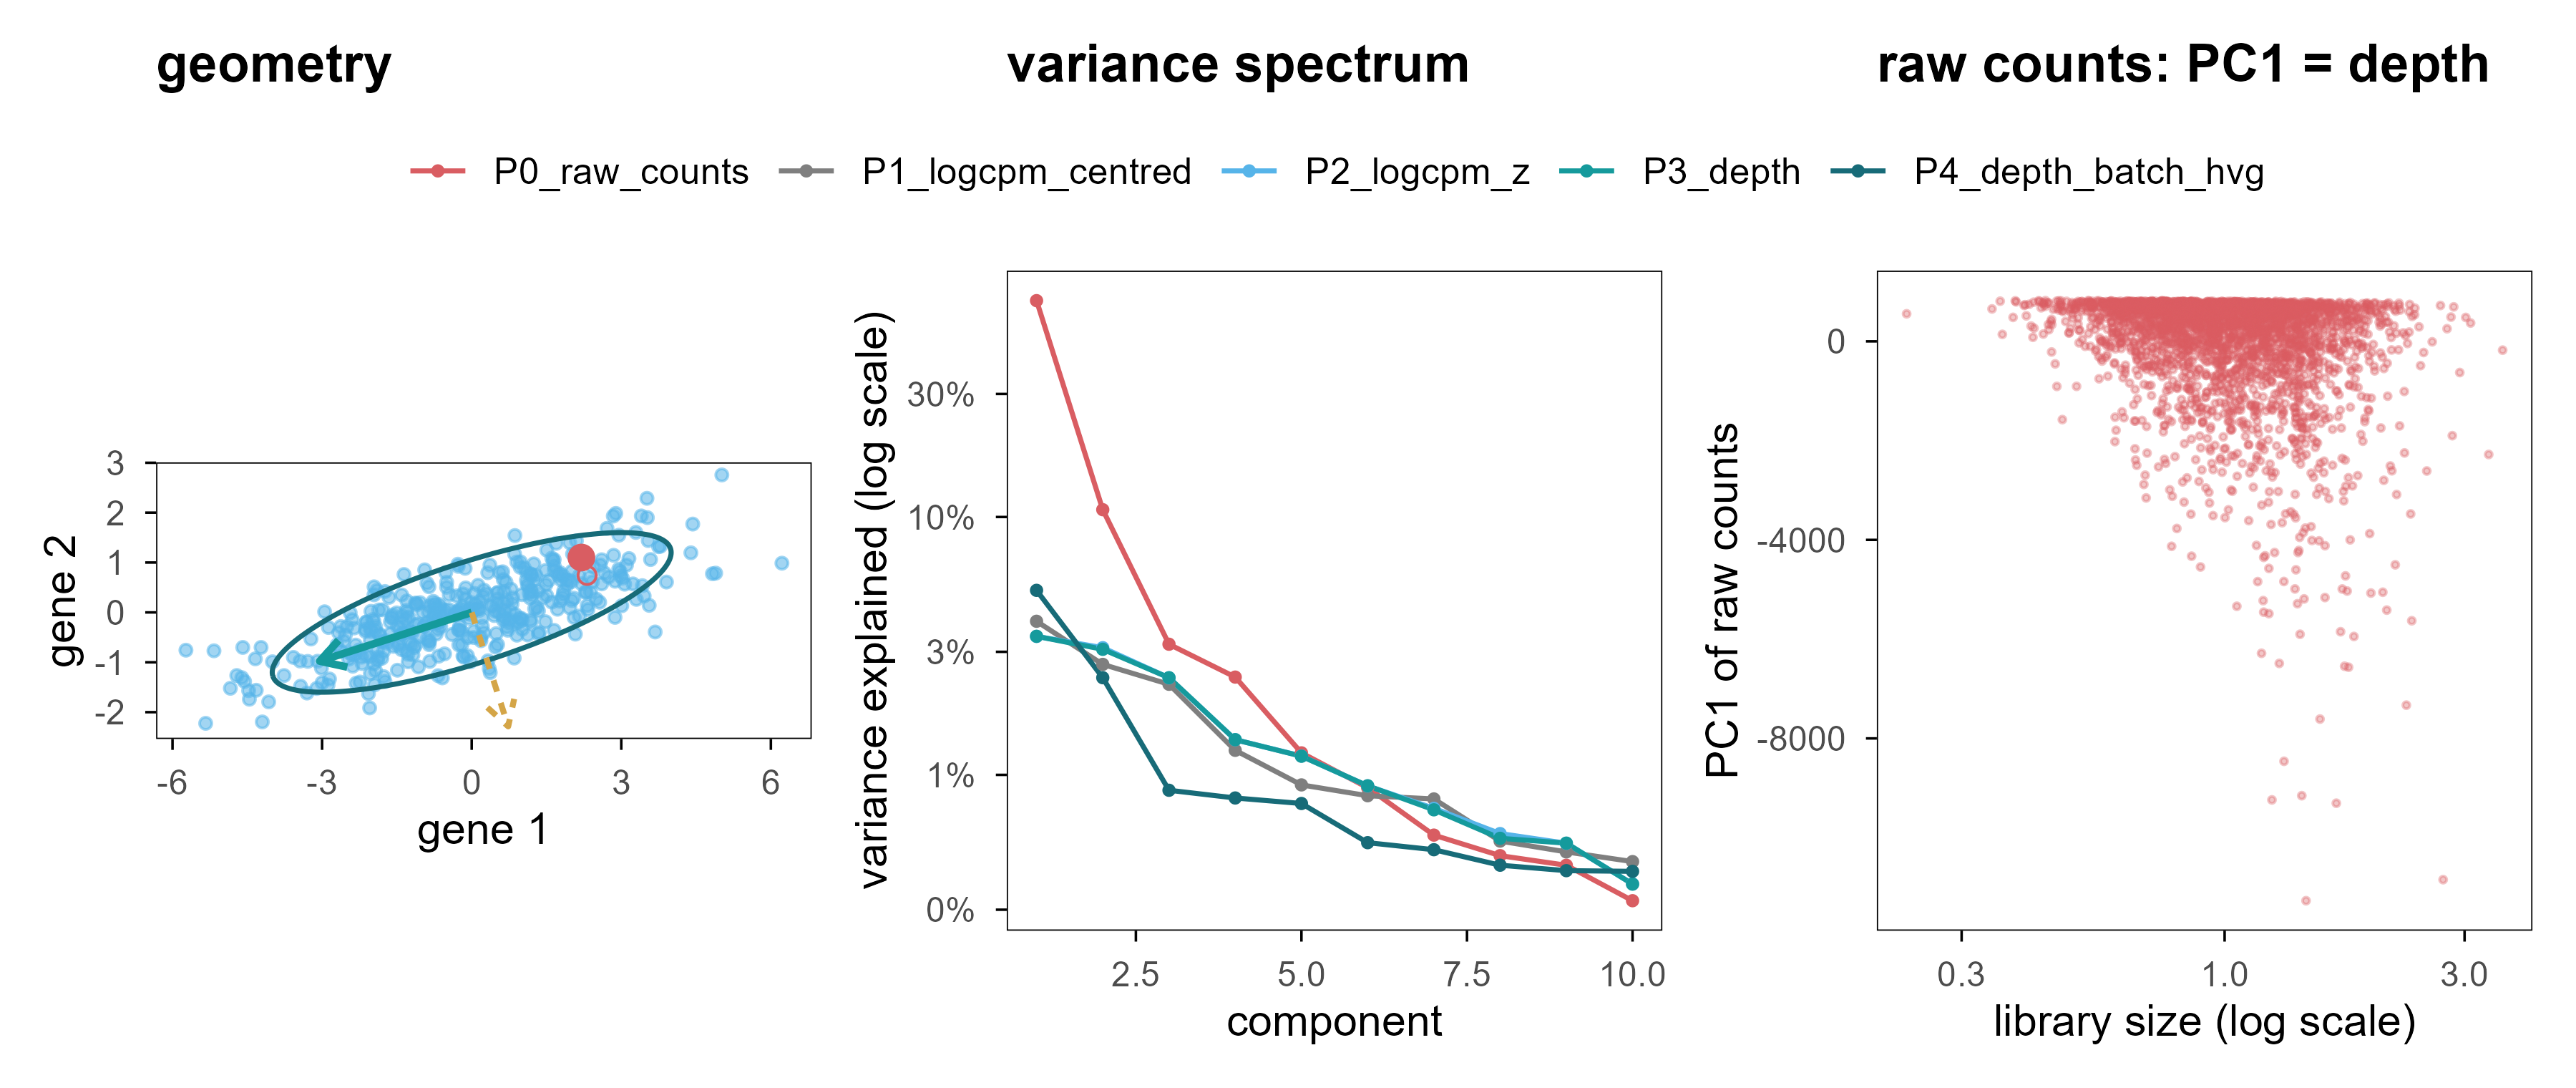
Figure 2: 图 2 PCA 的几何直觉与三个警示。(a) 二维高斯云、协方差椭圆与两条主轴;金色点投影到第一主轴上的位置就是它的 PC1 得分。(b) 五种预处理方案的解释方差谱。(c) 未经文库大小归一化的原始计数:PC1 几乎完全由测序深度决定。 | Figure 2. PCA geometry and three warnings. (a) A bivariate Gaussian cloud with its covariance ellipse and principal axes; the gold point is projected onto PC1. (b) Scree plots for five preprocessing pipelines. (c) Raw counts without library-size normalisation: PC1 is essentially sequencing depth.
PCA geometry (a), the variance spectrum of five pipelines (b), and what happens without normalisation (c).
Figure 2a is static. The interactive version below lets you change the correlation between two genes and watch the principal axes rotate and the projected point move. That is all PCA does: the axes follow the covariance, not any meaning.
Code
rhos <-c(0, 0.7, -0.7)set.seed(11)base_pts <- MASS::mvrnorm(300, c(0, 0), diag(2))pfig <-plot_ly()vis_list <-list()for (i inseq_along(rhos)) { r <- rhos[i] S <-matrix(c(4, r *1.6, r *1.6, 0.64), 2, 2) ee <-eigen(S) P <- base_pts %*%chol(S) th <-seq(0, 2*pi, length.out =120) el <-cbind(2*cos(th)*sqrt(ee$values[1]), 2*sin(th)*sqrt(ee$values[2])) %*%t(ee$vectors) pfig <- pfig |>add_markers(x = P[, 1], y = P[, 2], name ="cells", visible = (i ==1),marker =list(size =3, color ="#56B4E9", opacity =0.5)) |>add_lines(x = el[, 1], y = el[, 2], name ="covariance", visible = (i ==1),line =list(color ="#176B78", width =2), showlegend =FALSE) |>add_segments(x =0, y =0, xend = ee$vectors[1, 1] *3.2, yend = ee$vectors[2, 1] *3.2,name ="PC1", visible = (i ==1),line =list(color ="#159A9C", width =5), showlegend =FALSE) |>add_segments(x =0, y =0, xend = ee$vectors[1, 2] *2.6, yend = ee$vectors[2, 2] *2.6,name ="PC2", visible = (i ==1),line =list(color ="#D4A547", width =4), showlegend =FALSE) v <-rep(FALSE, 4*length(rhos)); v[(4* (i -1) +1):(4* i)] <-TRUE vis_list[[i]] <- v}pfig <- pfig |>layout(title ="gene-gene correlation drives the axes",xaxis =list(title ="gene 1", range =c(-8, 8), zeroline =TRUE,zerolinecolor ="#cccccc"),yaxis =list(title ="gene 2", range =c(-5, 5), zeroline =TRUE,zerolinecolor ="#cccccc"),paper_bgcolor ="rgba(0,0,0,0)", plot_bgcolor ="rgba(0,0,0,0)",updatemenus =list(list(type ="buttons", direction ="right", x =0.5, xanchor ="center", y =1.15,buttons =lapply(seq_along(rhos), function(i) list(label =sprintf("rho = %.1f", rhos[i]), method ="update",args =list(list(visible = vis_list[[i]]), list(title =sprintf("gene-gene correlation = %.1f", rhos[i]))))) )))pfig
Figure 3: 图 2b(交互) 点击按钮切换基因间相关性,观察协方差椭圆与主轴的旋转。 | Figure 2b (interactive). Switch the gene-gene correlation and watch the covariance ellipse and principal axes rotate.
Because \(X_c^\top X_c = V\Sigma^2V^\top\), the columns of \(V\) are eigenvectors of the covariance matrix and \(\sigma_k^2/(N-1)\) is the variance of component \(k\). Scores and projection are then the same operation:
This explains both why the PCA “encoder” is a linear map and its fundamental limitation: it can only compress along straight directions. If the data lie on a curved manifold, any straight direction captures only a small piece of it.
3.3 实验 1:方差解释率不等于状态恢复 / Experiment 1: variance explained is not state recovery
We compare five preprocessing pipelines on the same simulation. ve3 is the variance explained by three components; rec_err3 is the relative reconstruction error on held-out cells; r_t, r_a, r_branch are the largest absolute Spearman correlations between the first five components and the true factors \(t, a, s\); knn is the overlap of 10-nearest-neighbour sets between the component space and the true latent space.
Code
m <- e1$metricstab <-data.frame(`方案 / pipeline`= m$pipeline,`ve3`=sprintf("%.3f", m$ve3),`rec_err3`=sprintf("%.3f", m$rec_err3),`r_t`=sprintf("%.2f", m$r_t),`r_a`=sprintf("%.2f", m$r_a),`r_branch`=sprintf("%.2f", m$r_branch),`kNN`=sprintf("%.2f", m$knn),check.names =FALSE)knitr::kable(tab, caption ="五种预处理方案的 PCA 指标。 | PCA metrics for five preprocessing pipelines.")
Table 2: 五种预处理方案的 PCA 指标。 | PCA metrics for five preprocessing pipelines.
The first row is the uncomfortable one. Without library-size normalisation, three components explain 82.9% of the variance with a reconstruction error of only 0.44, yet recovery of \(t\) is 0.70 and recovery of activation is essentially zero. The reason is simple: in raw counts, most of the total variance is technical — depth times gene length — and PCA faithfully finds the direction of maximum variance. That direction is just not biology.
This is the first lesson the article keeps returning to: “variance explained” is relative to the total variance, and the total variance may contain almost no biological signal.
After normalisation, the first three components line up with branch, differentiation time and activation. Two things are worth noting. First, their order has nothing to do with biological importance: the branch effect is amplified by \(w(t)\) at late times, so it carries the most variance. Second, their magnitude: together the three components explain only 8.9% of the variance; the remaining 90-odd percent is counting noise.
3.4 一个可监督的上限 / A supervised ceiling
如果所有非监督方法都只拿到 knn ≈ 0.12–0.15,这是方法的问题还是数据的问题?我们用「作弊」的方式给出一个上限:把 \((t, a, s)\) 直接对表达矩阵做线性回归,用拟合值作为嵌入。
If every unsupervised method reaches only knn ≈ 0.12-0.15, is that the method’s fault or the data’s? We cheat to get a ceiling: regress \((t, a, s)\) linearly on the expression matrix and use the fitted values as an embedding.
Even with the answer in hand, 10-nearest-neighbour overlap reaches only 0.27. So the gap between 0.12-0.15 and this ceiling is mostly measurement noise, not algorithmic weakness. That cuts both ways: we should not claim one method beats another on a 0.13-versus-0.15 difference, and we should be suspicious of any claim that a method “perfectly recovers cell state” from single-cell data.
3.5 敏感性分析:批次效应何时接管 / When does a batch effect take over?
主模拟里的批次效应是刻意温和的。把同样的生成器重跑一次,把批次偏移放大三倍,情况立刻改变:
The batch effect in the main simulation is deliberately mild. Re-running the same generator with a three-fold stronger batch shift changes the picture immediately:
Code
knitr::kable(transform(e1$sens_batch,batch_r2_pc15 =sprintf("%.2f", batch_r2_pc15),r_t =sprintf("%.2f", r_t), ve1 =sprintf("%.3f", ve1)),col.names =c("阶段 / stage", "批次 R²(PC1–5)", "r_t", "PC1 方差"),caption ="强批次效应下的主成分。 | Leading components under a strong batch effect.")
Table 4: 强批次效应下的主成分。 | Leading components under a strong batch effect.
With the batch effect present, 98% of PC1’s variance is explained by batch, and PC1’s share jumps from about 3.0% to 14.4%. The subtler point is the second row: simple per-batch centring drives the batch R² to zero, but recovery of \(t\) falls from 0.92 to 0.74. Batch correction is not free — when batch is partly confounded with state, subtracting batch means also subtracts real signal.
4. UMAP:高维世界的局部地图 / UMAP: A Local Map of a High-Dimensional World
What sets UMAP apart is that it does not try to preserve global distances. It first builds a fuzzy local neighbour graph in the high-dimensional space, then searches for a low-dimensional layout that best preserves that graph. Its objective is about neighbourhood relations, not distances.
4.1 算法在优化什么 / What the algorithm optimises
高维侧,对每个点 \(i\),用指数核定义条件概率并做对称化:
On the high-dimensional side, for each point \(i\) an exponential kernel defines a conditional probability, which is then symmetrised:
Here \(\rho_i\) is the distance to the nearest neighbour (which guarantees local connectivity) and \(\sigma_i\) is solved so that the effective neighbour count equals \(k\). On the low-dimensional side a heavy-tailed curve \(q_{ij} = (1 + a\lVert y_i-y_j\rVert^{2b})^{-1}\) is used, and the loss is their cross-entropy:
The first term attracts high-dimensional neighbours, the second repels non-neighbours. The exponent \(b\) controls how heavy the tail is, hence how tightly clusters may pack — that is what min_dist tunes.
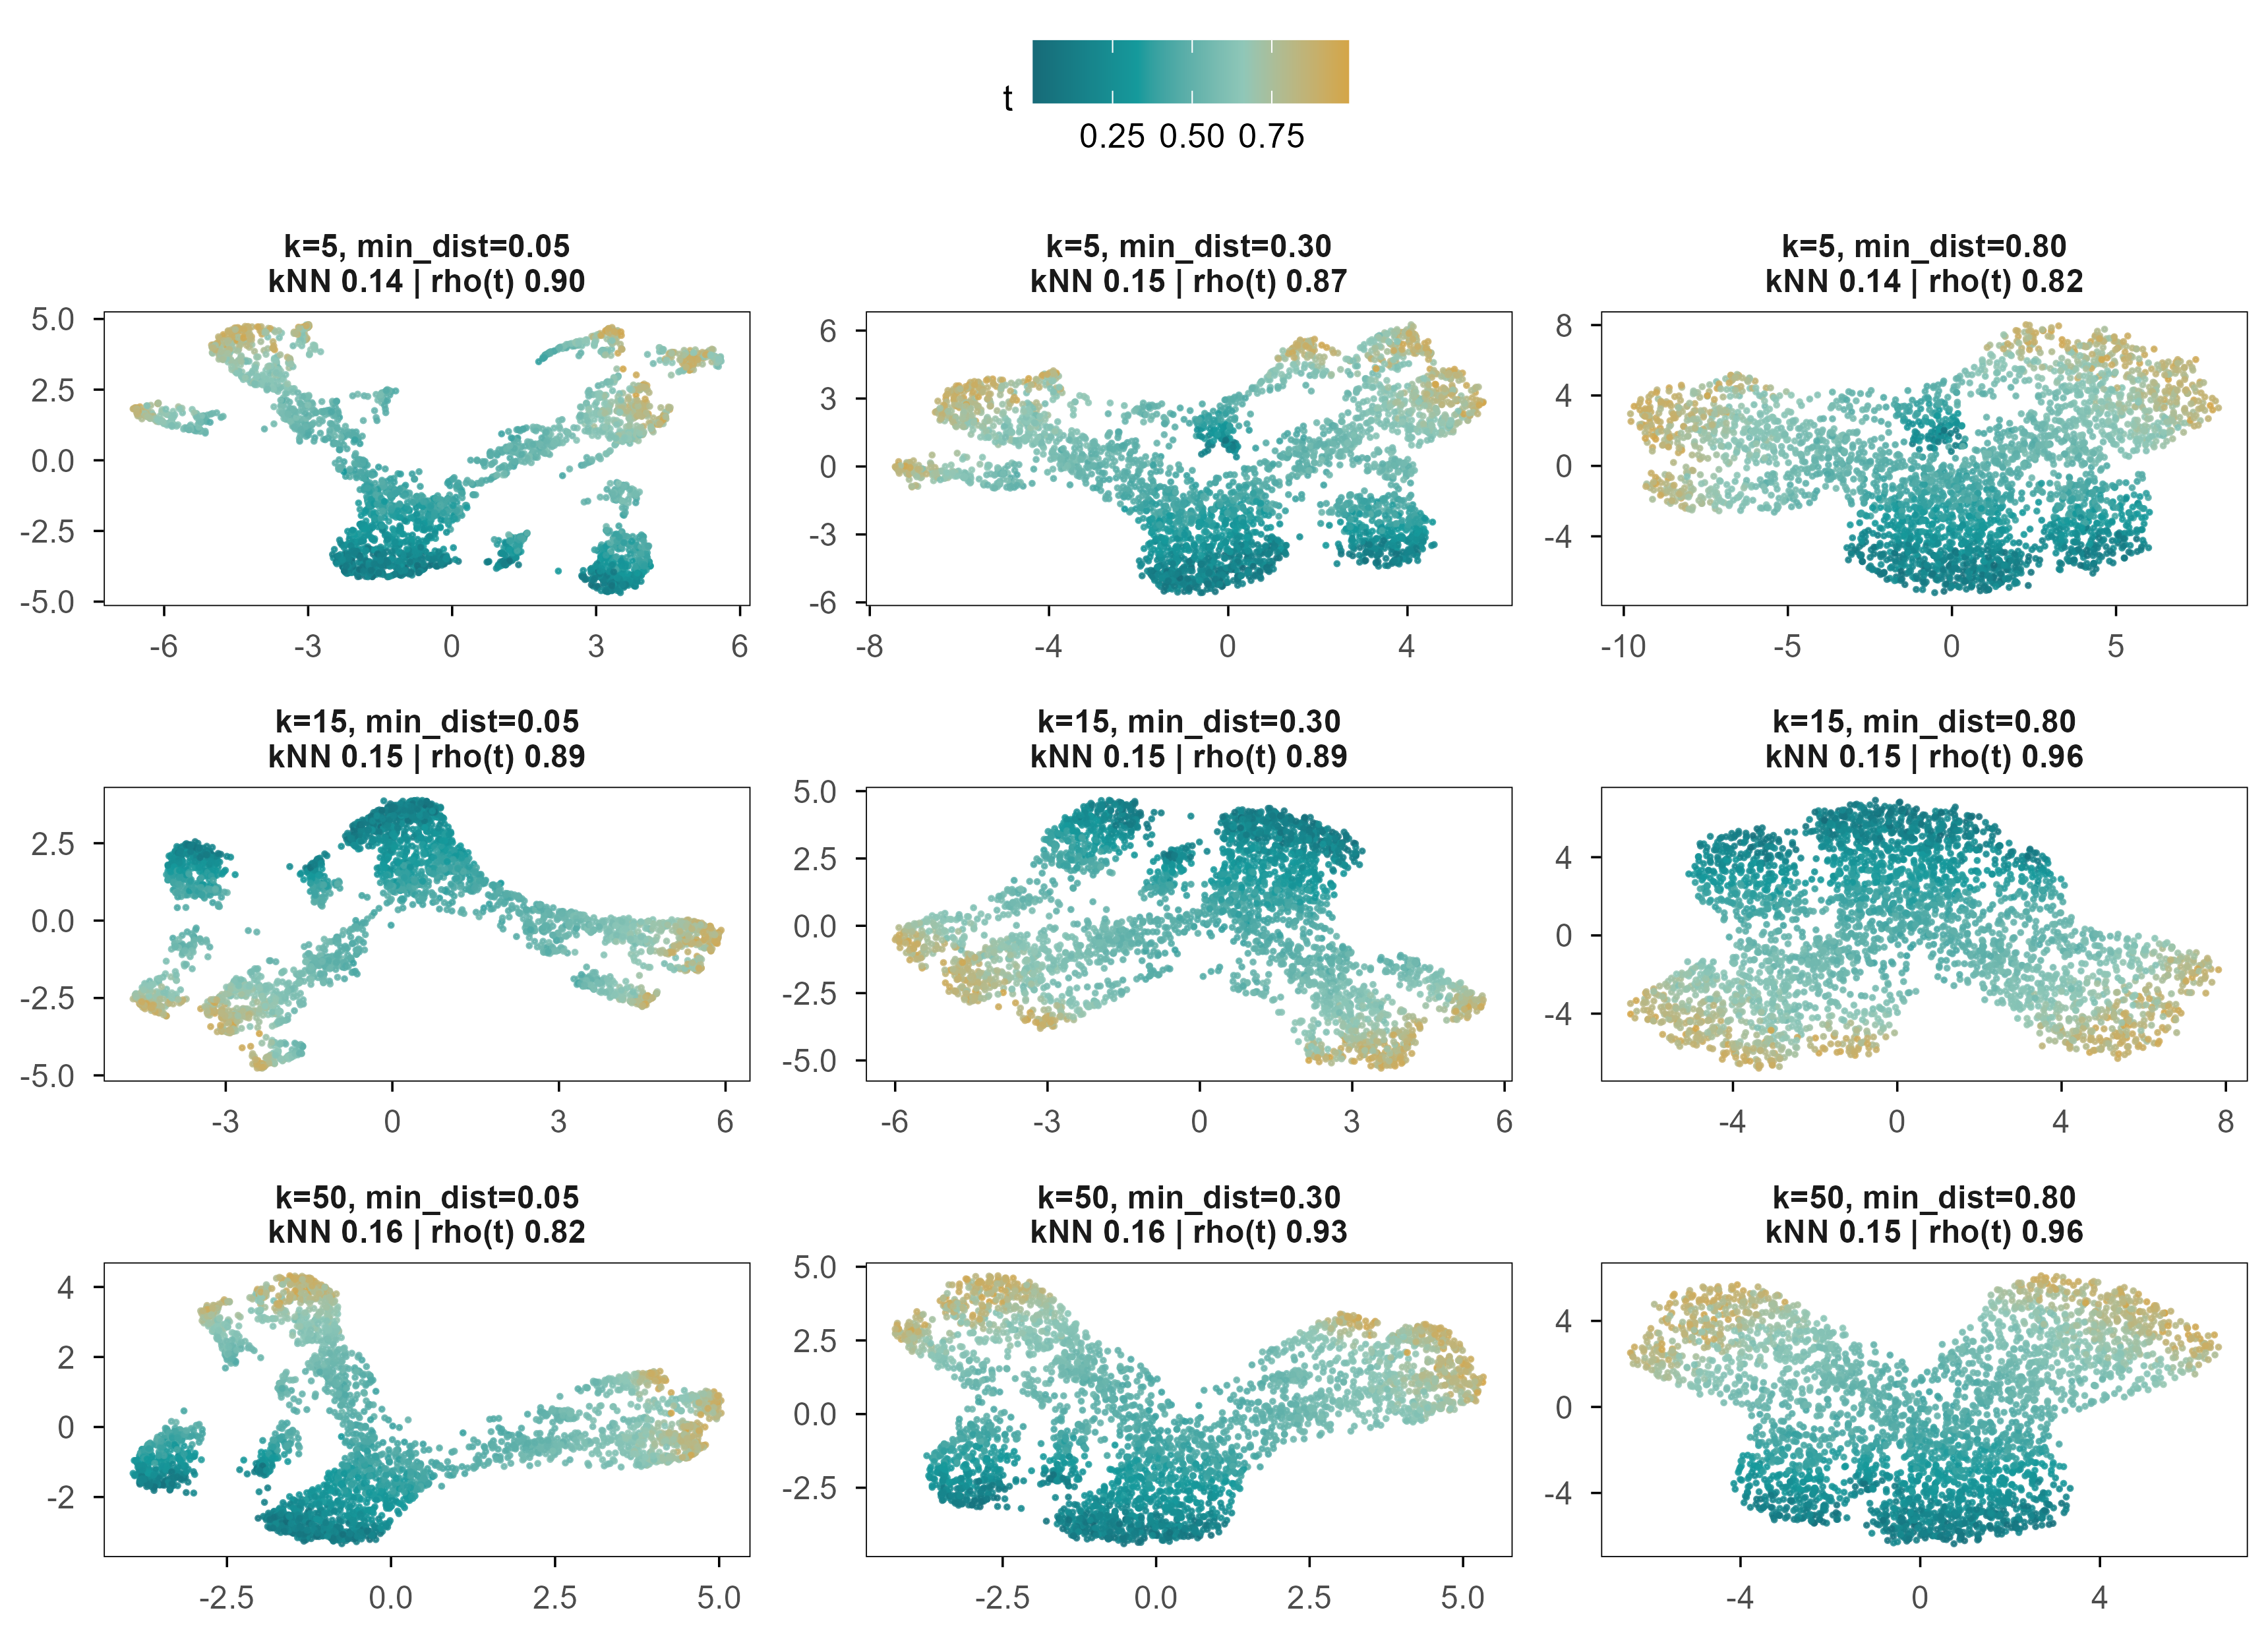
Figure 4: 图 3 同一批细胞、同一份预处理、九组 UMAP 参数。颜色为真实分化进程 \(t\),面板标题给出该参数下的 10 近邻保持率与 \(t\) 的 Spearman 相关。 | Figure 3. The same cells, the same preprocessing, nine UMAP settings. Colour is the true differentiation time \(t\); panel titles give 10-nearest-neighbour preservation and the Spearman correlation with \(t\).
All nine panels look “good”: a continuous colour gradient, a clear bifurcation. Yet their neighbourhood preservation is nearly identical (0.13-0.16), while the correlation with \(t\) ranges from 0.82 to 0.96. In other words, the parameters mainly change what it looks like, not how much information it keeps.
4.3 稳定性:随机种子与重采样 / Stability: seeds and subsampling
Code
stab <- e2$stabilitydata.frame(`扰动 / perturbation`=c("随机种子 1 vs 2", "随机种子 1 vs 3", "随机种子 2 vs 3","80% 重采样", "直接输入基因 vs 先做 50 个 PC"),`Procrustes 相似度 / similarity`=sprintf("%.3f", c(stab$seed_sim, stab$subsample_sim, stab$raw_vs_pc))) |> knitr::kable(caption ="UMAP 布局在不同扰动下的稳定性(1 = 完全一致)。 | Stability of the UMAP layout under perturbation (1 = identical).")
Table 5: UMAP 布局在不同扰动下的稳定性(1 = 完全一致)。 | Stability of the UMAP layout under perturbation (1 = identical).
Same data, same parameters, different random seed: Procrustes similarity of the layouts is 0.954-0.985. Drop 20% of the cells and it falls to 0.775. That is more stable than many people expect, but stability is not correctness: a map that consistently distorts distances will consistently mislead you.
4.4 距离与簇间距的失真 / Distortion of distance and separation
In the simulation, the true silhouette of the branch labels is 0.66. Across the nine settings UMAP gives 0.76-0.87, all above the truth, with the most extreme setting inflating branch separation by roughly 1.3-fold. This is why clusters look so far apart in a UMAP plot: it is a consequence of the objective, not of the biology.
Hence the position of this article: UMAP is an exploratory visualisation tool, not a generative model of cell state, and it should not be used to compare distances between clusters. The next chapter shows that if you care about distances along the manifold, you should model the manifold explicitly.
5. 细胞状态真的位于流形上吗? / Do Cellular States Lie on a Manifold?
The manifold hypothesis is the implicit premise of almost every single-cell dimensionality-reduction method: high-dimensional observations are not spread through a \(G\)-dimensional box but concentrate on a low-dimensional, possibly curved surface. A differentiation trajectory is the clearest example — cells move along a continuous path from progenitors to terminal states, and the path itself is curved in expression space.
5.1 卷曲的空间 / A rolled-up space
Swiss roll 是检验这类方法的经典例子:一个二维平面被卷成三维螺旋。数据的内在维度是 2,但任何线性投影都会把不同层叠在一起。
The Swiss roll is the classical test: a two-dimensional sheet rolled into a three-dimensional spiral. The intrinsic dimension is 2, but any linear projection superimposes different layers.
Figure 5: 图 4a(交互) Swiss roll:拖动旋转,可见相邻层在三维中靠得很近、在参数空间中却相距很远。颜色为真实曲线位置。 | Figure 4a (interactive). The Swiss roll: drag to rotate. Adjacent layers are close in 3-D but far apart along the underlying parameter. Colour is the true position along the curve.
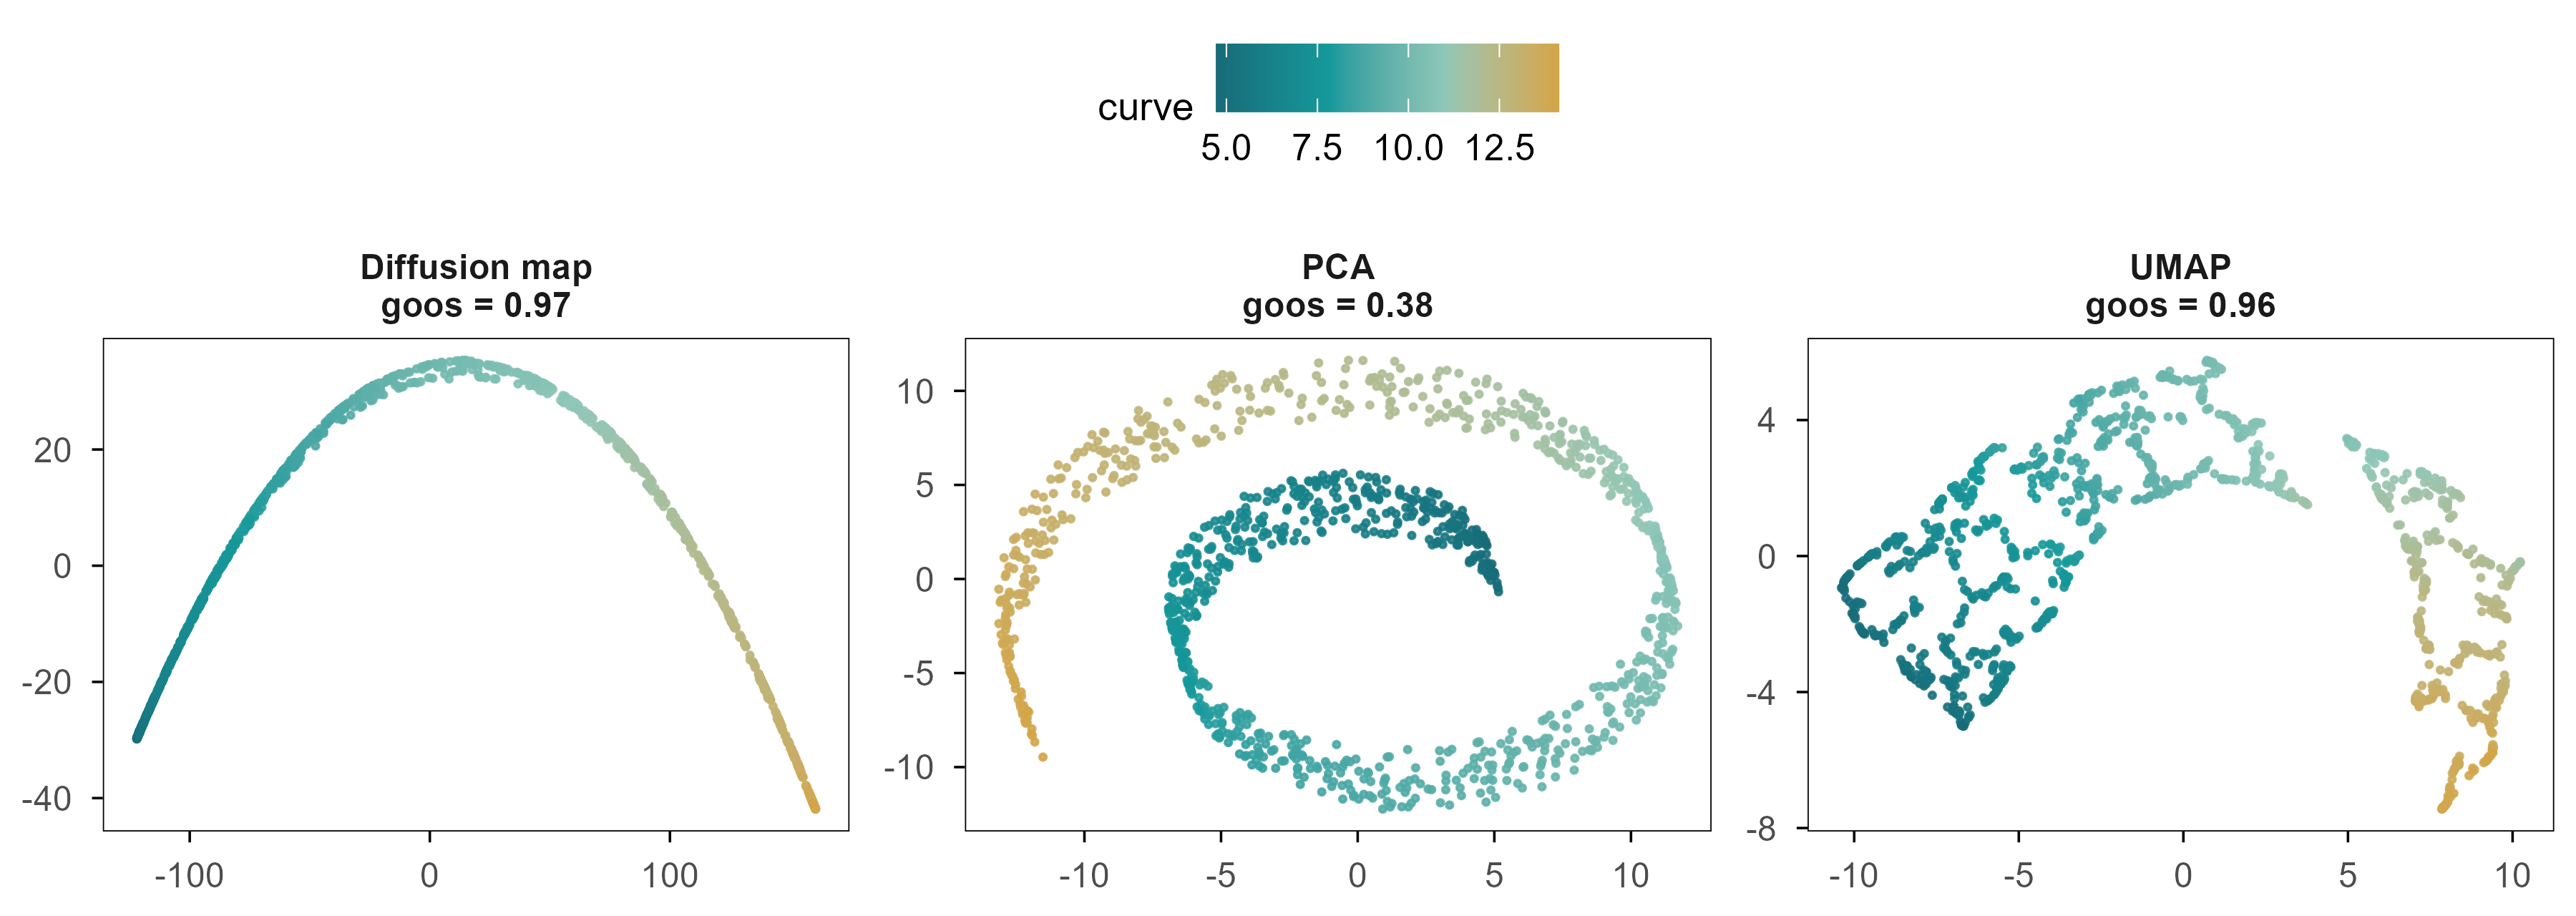
Figure 6: 图 4b 同一个 Swiss roll 的三种二维展开。颜色为真实曲线位置;标题给出二维距离与图测地距离的 Spearman 相关。 | Figure 4b. Three two-dimensional unfoldings of the same Swiss roll. Colour is the true position along the curve; titles give the Spearman correlation between 2-D distance and graph-geodesic distance.
三者的差别不是「好看程度」,而是是否保持了沿流形的距离。Swiss roll 上两点的真实距离是沿曲面的弧长;在二维嵌入里,我们只能用欧氏距离去近似它。用图上最短路作为测地距离的代理,三种方法与它的 Spearman 相关分别是 PCA 0.38、UMAP 0.96、Diffusion Map 0.97。
The difference between the three is not cosmetic; it is whether distances along the manifold are preserved. The true distance between two points on a Swiss roll is arc length along the sheet, which a 2-D embedding can only approximate with Euclidean distance. Using shortest paths on a k-nearest-neighbour graph as a proxy for geodesic distance, the Spearman correlations are 0.38 for PCA, 0.96 for UMAP and 0.97 for diffusion maps.
5.2 Diffusion map:把「随机游走」变成坐标 / Turning a random walk into coordinates
Diffusion maps take a different route. They define a Markov chain on the data: starting from cell \(i\), jump to neighbour \(j\) with probability proportional to their similarity. The multiscale structure of that random walk then becomes the coordinate system.
具体地,用自适应高斯核构造相似度矩阵,再做 \(\alpha = 1\) 的归一化:
Concretely, build a similarity matrix with an adaptive Gaussian kernel and apply the \(\alpha = 1\) normalisation:
\[
W_{ij} = \exp\!\left(-\frac{\lVert x_i - x_j\rVert^2}{\varepsilon_i \varepsilon_j}\right), \qquad
K = D^{-1} W D^{-1}, \qquad D_{ii} = \sum_j W_{ij}
\]
where \(\varepsilon_i\) is the distance to the \(k\)-th neighbour, so the kernel width adapts to local density. The largest eigenvalue of \(K\) is always 1 (the stationary distribution); the remaining eigenpairs \((\lambda_\ell, \psi_\ell)\) give coordinates
In these coordinates Euclidean distance approximates the diffusion distance: the difference in transition density between \(i\) and \(j\) over all paths. Unlike geodesic distance, diffusion distance does not depend on a single shortest path; it weights all of them, which makes it more robust at large scales.
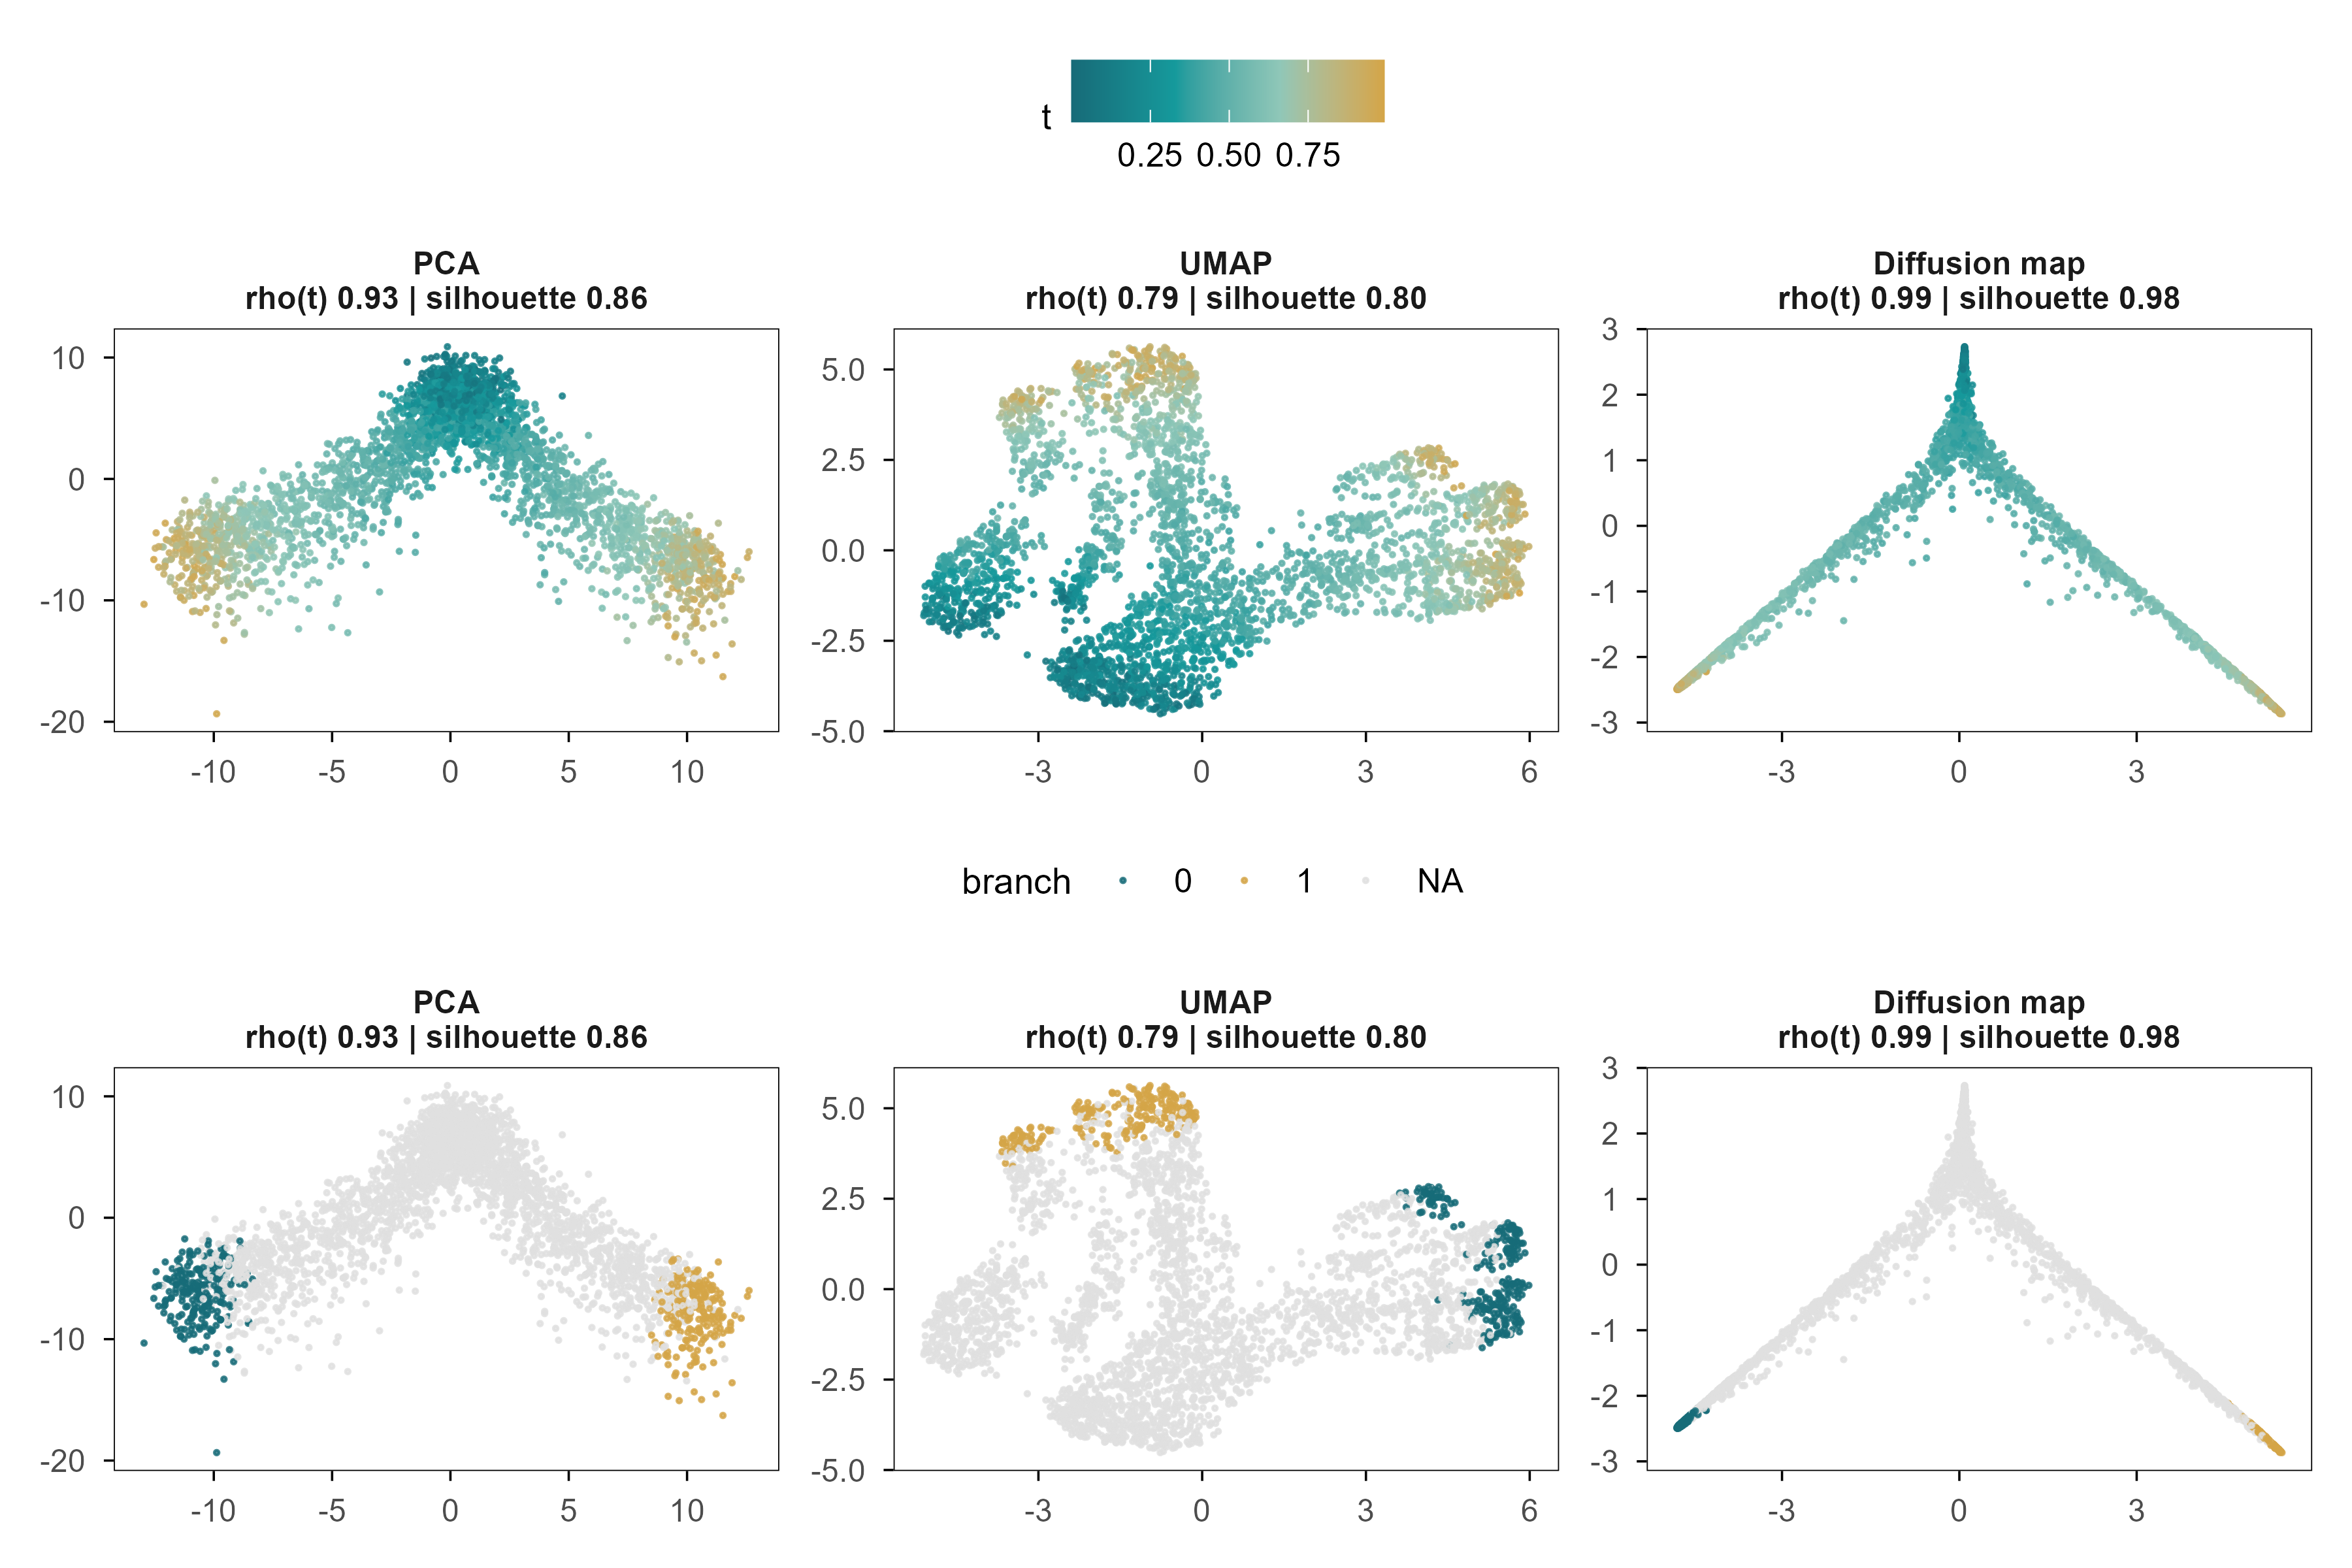
Figure 7: 图 5 PCA、UMAP 与 Diffusion Map 恢复的分化轨迹。颜色为真实分化进程 \(t\);下排为同一嵌入按分支着色(仅 \(t>0.75\) 的细胞)。每个面板标题给出与 \(t\) 的 Spearman 相关和分支轮廓系数。 | Figure 5. The differentiation trajectory recovered by PCA, UMAP and diffusion maps. Colour is the true differentiation time \(t\); the lower row colours the same embeddings by branch (\(t>0.75\) cells only). Panel titles give the Spearman correlation with \(t\) and the branch silhouette.
三个面板都呈现出 Y 形分叉,但它们对同一条轨迹的表达并不相同。与 \(t\) 的相关:PCA 0.93,UMAP 0.79,Diffusion Map 0.99。在这个模拟里,PCA 已经很接近最优——因为我们的分化程序本来就是近似可加的。这说明「非线性方法更好」不是普遍规律,而是取决于流形是否真的弯曲。
All three panels show a Y-shaped bifurcation, but they express the trajectory differently. Correlation with \(t\): PCA 0.93, UMAP 0.79, diffusion maps 0.99. In this simulation PCA is already close to optimal, because the differentiation programmes were built to be approximately additive. Nonlinear methods are not universally better; it depends on whether the manifold is actually curved.
Branch separation is another matter. The true silhouette is 0.68; the three methods give 0.86, 0.80 and 0.98 — all inflated, diffusion maps by about 1.4-fold. Any two branches that look far apart in a 2-D plot are, in reality, closer than they appear.
The eigenvalues of a diffusion map are ordered by graph scale, not by biology. In our system the first non-trivial diffusion component is almost uncorrelated with \(t\) (0.062) and tracks the branch instead; the second component is the one that follows \(t\) (0.985). In other words, if you take DC1 as pseudotime you get the branch, not the time.
Pseudotime has a deeper problem: it is only the index of a cell along an inferred path, not calendar time and not the number of divisions. We can hope the ordering is roughly right; we cannot assume the spacing is proportional.
6. Autoencoder 与 VAE:学习一个可生成的空间 / Autoencoders and VAEs: Learning a Generative Representation
PCA’s encoder is linear, UMAP has no decoder, and diffusion maps have no parametric generative rule. If we want a space that both encodes and generates, the direct approach is to train a pair of neural networks.
This is essentially the PCA objective with a nonlinear function class. The difference is fundamental: with wide enough hidden layers \(f_\theta\) can flatten a curved manifold, which a linear projection cannot. The cost is that the reconstruction objective contains no constraint that the latent dimensions be meaningful — only that information is not lost.
6.2 VAE:给潜在空间加一个先验 / Adding a prior to the latent space
A VAE introduces two distributions: the encoder outputs an approximate posterior \(q_\phi(z\mid x)\), the prior is \(p(z)=\mathcal{N}(0,I)\), and the decoder gives the likelihood \(p_\theta(x\mid z)\). The marginal likelihood \(\log p(x)\) is intractable, so we maximise a lower bound:
Reparameterising as \(z = \mu + \sigma\odot\epsilon\) with \(\epsilon\sim\mathcal{N}(0,I)\) makes the bound differentiable in \(\phi\). The first term asks that \(x\) be reconstructable from \(z\); the second keeps the posterior near the prior. They pull against each other: with only the first term the model degenerates into an autoencoder whose latent space is torn into disconnected points; with only the second it collapses to the prior and reconstructs nothing.
6.3 一个真实的失败:ELBO 的尺度 / A real failure: the scale of the ELBO
In our first implementation the reconstruction term was averaged over genes with \(\beta=1\). The training curve was flat, the test error equalled predicting the mean, and no latent dimension correlated with any true factor — complete posterior collapse. The cause was not capacity but scale: the mean squared error over 1,000 genes is about 0.9, while a 4-dimensional KL term easily reaches tens. Numerically, KL overwhelmed reconstruction.
修正办法是对基因求和而不是取平均,使两项处于同一量级:
The fix is to sum over genes rather than average, putting the two terms on the same scale:
This is not a tuning trick; it is the structure of the ELBO: the likelihood is a joint probability over all observed dimensions, the KL over latent dimensions, and the two live on different scales by construction. Comparing \(\beta\) across datasets without stating the dimensions is meaningless.
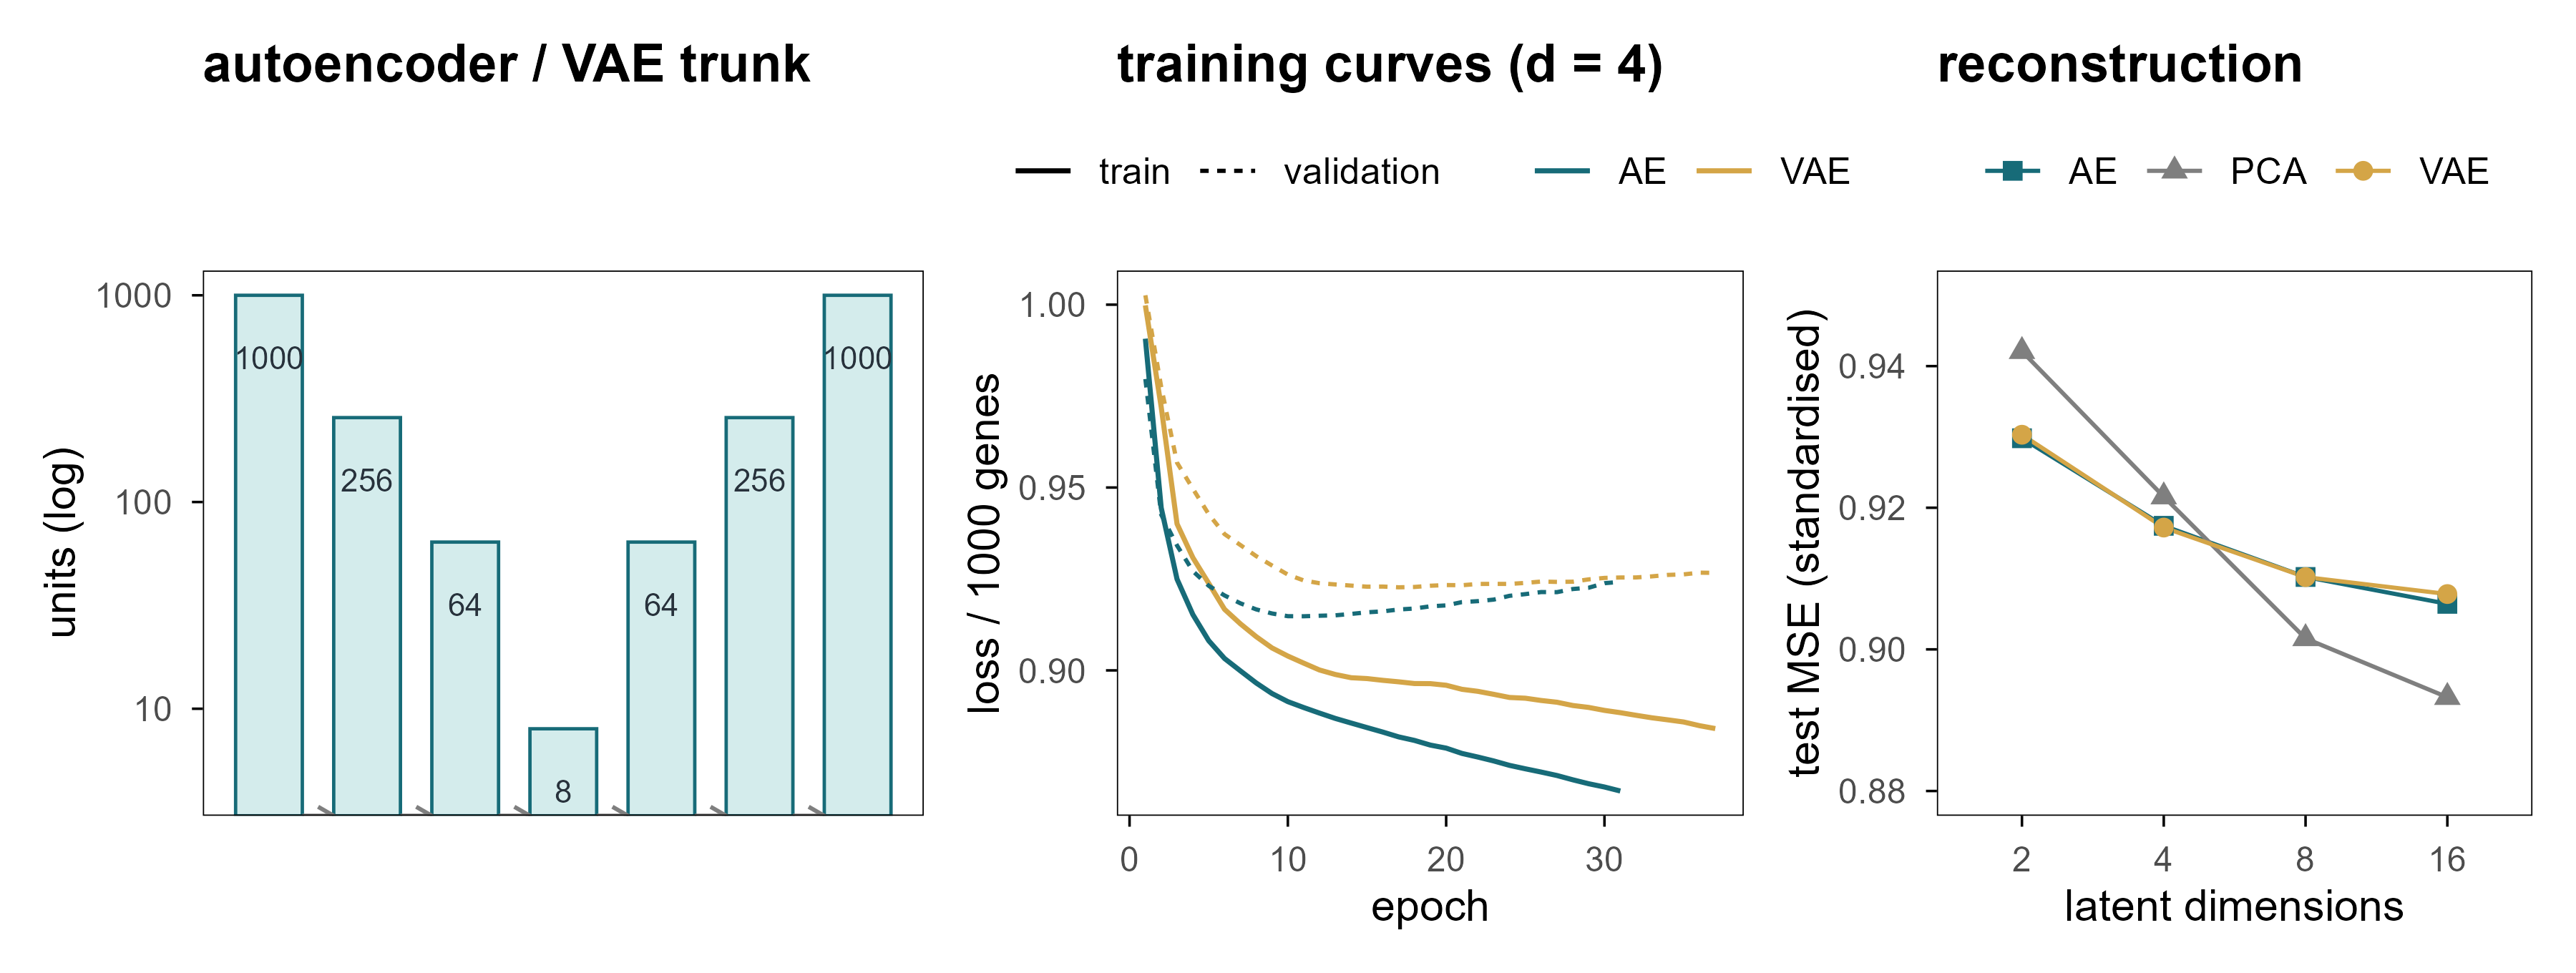
Figure 8: 图 6 (a) 网络结构:编码器与解码器共享同一个瓶颈。(b) 实际训练曲线(d = 4),点线为验证集。(c) 测试集重建误差随潜在维度的变化;灰色虚线是「直接预测均值」的误差。 | Figure 6. (a) Architecture: encoder and decoder share one bottleneck. (b) Actual training curves at d = 4, dotted line is validation. (c) Test reconstruction error versus latent width; the grey dashed line is the error of predicting the mean.
Three things stand out. First, every model lands between 0.893 and 0.942, against 1.0 for predicting the mean — barely better than doing nothing, because only about 9% of the variance is signal. Second, extra dimensions buy very little: from 2 to 16 dimensions the AE error moves only from 0.930 to 0.906. Third, the nonlinear models do not clearly beat PCA, because the linear structure already suffices here.
6.5 概率潜在空间与插值 / A probabilistic latent space and interpolation
The value of a VAE is not better reconstruction but that it defines a probability density over the whole space. That lets us sample from the prior, interpolate between points, and ask whether a region contains any cells at all. Chapter 9 shows that this ability can be used both for experimental design and for producing hallucinations.
To handle counts we also trained a negative-binomial decoder: it outputs an expected expression \(\mu\) and maps back to the count scale with a fixed library-size offset.
On held-out cells its per-gene negative log-likelihood is 7.042 and the Spearman correlation between predicted mean and observed counts is 0.262. These numbers say it captured the overall expression structure; they say nothing about causal mechanism.
Code
Z <- e5$Z# pick the two latent dimensions that track t and the branch bestct <-as.vector(abs(cor(Z, sim_truth$t, method ="spearman")))cb <-as.vector(abs(cor(Z, sim_truth$s_branch, method ="spearman")))i_t <-which.max(ct); i_b <-which.max(cb)if (i_t == i_b) i_b <-setdiff(order(ct, decreasing =TRUE), i_t)[1]tibble(z1 = Z[, i_b], z2 = Z[, i_t], t = sim_truth$t) |>ggplot(aes(z1, z2, colour = t)) +geom_point(size =0.5, alpha =0.8) +scale_colour_t(name ="t") +labs(x =sprintf("latent dimension %d (branch, rho = %.2f)", i_b, cb[i_b]),y =sprintf("latent dimension %d (time, rho = %.2f)", i_t, ct[i_t]))
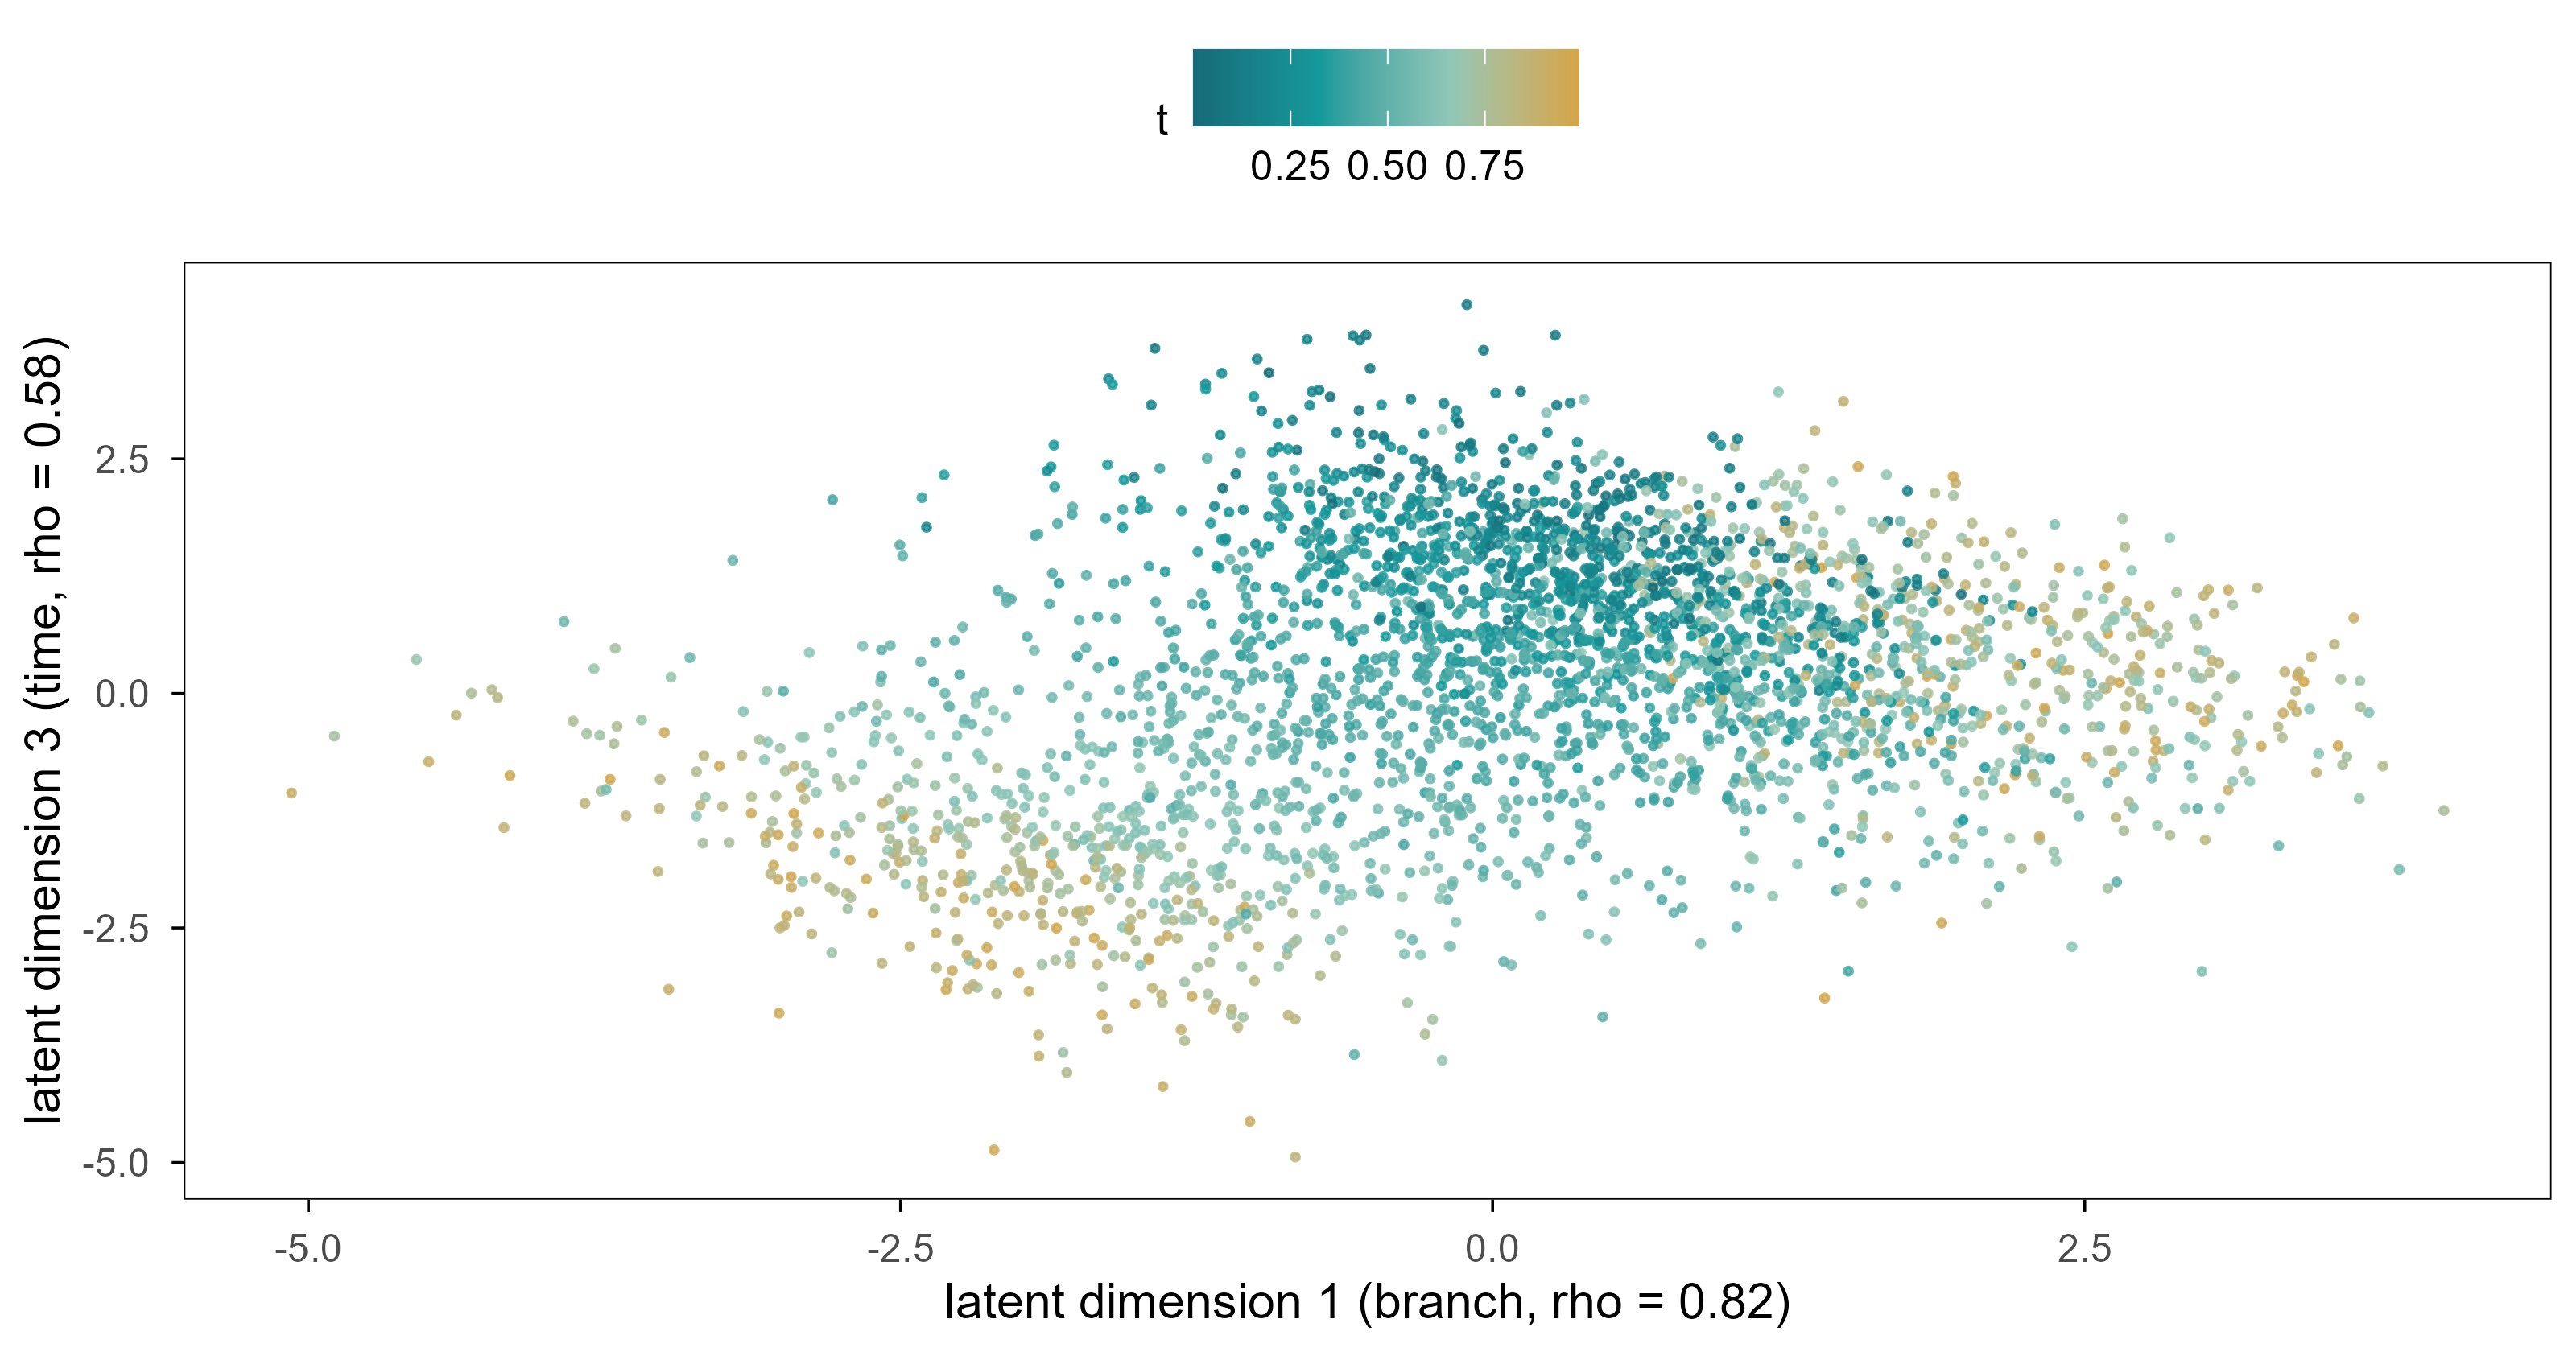
Figure 9: 图 7a 负二项 VAE 的四维潜在空间中分别跟踪分支与分化进程的两个维度。颜色为真实分化进程 \(t\)。 | Figure 7a. Two of the four latent dimensions of the negative-binomial VAE, tracking the branch and the differentiation time respectively. Colour is the true differentiation time \(t\).
In the Gaussian VAE’s latent space one dimension tracks the branch strongly (|ρ| = 0.82), but no single dimension represents time cleanly (the best is 0.58); time is spread across several dimensions. This contradicts the intuition that latent dimensions should be disentangled, and it is the norm for VAEs: invertible linear maps leave the likelihood unchanged, so the model has no incentive to align time with any particular axis.
The negative-binomial version is worth mentioning: its per-gene negative log-likelihood drops to 7.04 (not directly comparable to the Gaussian MSE of 0.917, but the direction is clear — the count likelihood fits better), yet its latent space is worse: correlation with time only 0.36 and with activation only 0.17. A better likelihood is not a better representation: the count likelihood spends most of its capacity on the absolute level of highly expressed genes, while the state signal lives in relative changes of lowly expressed ones.
Figure 10: 图 7b(交互) 沿潜在直线从细胞 A 走到细胞 B:滑动滑块改变 α,金色点给出解码后的位置(悬停可见两个分支模块的平均表达)。 | Figure 7b (interactive). Walking along the latent straight line from cell A to cell B: move the slider to change α; the gold point shows the decoded position, and hovering reveals the mean expression of the two branch modules.
Every point on this line decodes to a full expression profile. The natural next question is whether the intermediate states correspond to real cells. Chapter 9 gives a clear negative answer.
7. 潜在空间中的距离有生物学意义吗? / Does Distance in Latent Space Have Biological Meaning?
This is the section where it is easiest to go wrong, and where mistakes are most often ignored. Almost every single-cell paper says “cells separate into two groups on the UMAP”, but what “separate” means depends entirely on which space and which metric you used.
7.1 三种距离 / Three distances
基因空间的欧氏距离:直接反映表达谱差异,但被高维噪声严重稀释;两个生物学上相同的细胞,其欧氏距离可能远大于两个不同细胞。 Euclidean distance in gene space: it directly measures expression differences, but is diluted by high-dimensional noise; two biologically identical cells can be farther apart than two different ones.
潜在空间的欧氏距离:坐标是我们自己选的,距离的尺度随坐标系变化;旋转、缩放、甚至任意可逆线性变换都不改变拟合优度。 Euclidean distance in latent space: the coordinates are our choice, and the scale changes with them; rotation, scaling and any invertible linear map leave the fit unchanged.
沿流形的测地距离:最接近「细胞状态差多少」的直觉,但需要先有一个可靠的图,而图的构造本身又依赖尺度和近邻数。 Geodesic distance along the manifold: closest to the intuition of “how different are these states”, but it requires a reliable graph, and building that graph depends on scale and neighbour count.
The non-uniqueness of the second kind can be stated in one line: if \(z=f(x)\) and \(\hat x = g(z)\) form an encoder-decoder pair, then for any invertible \(A\), \(z' = Az\) with \(g'(z') = g(A^{-1}z')\) gives exactly the same reconstruction. The coordinates of a latent space are never uniquely determined by the data; the axes we see are chosen jointly by the optimiser and the initialisation.
7.2 局部结构比全局距离更可靠 / Local structure survives better than global distance
In the simulation, the distance correlation between the first three principal components and the true latent space is 0.69, while 10-nearest-neighbour overlap is only 0.12. The gap says: the embedding roughly preserves who is far from whom, but not the finer “who is next to whom” structure — and the latter is what clustering and trajectory inference actually rely on.
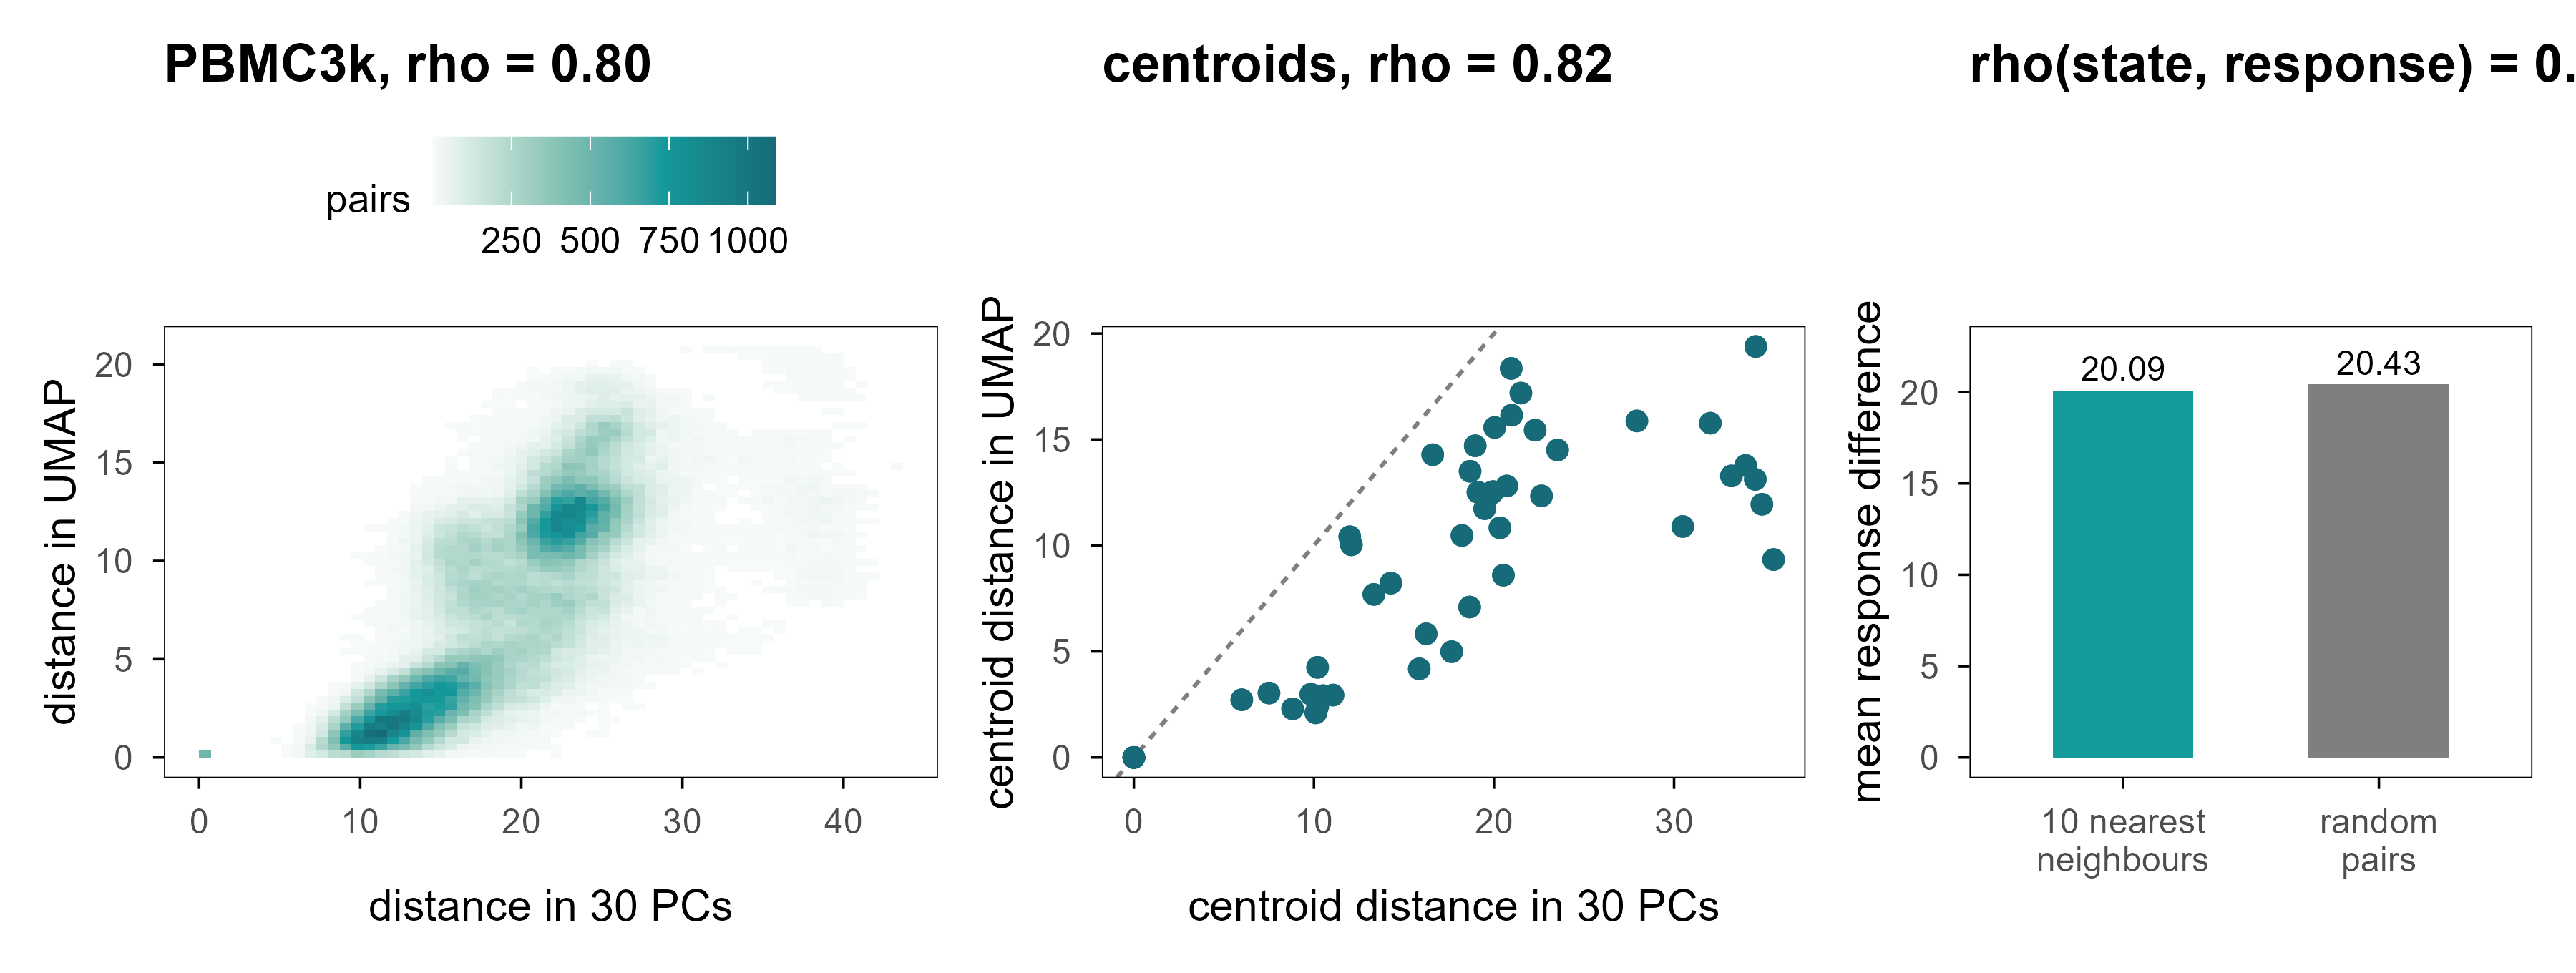
Figure 11: 图 8 潜在空间中的距离。(a) PBMC3k:500 个细胞两两之间的 30 维 PC 距离与 UMAP 二维距离(Spearman 相关见图内)。(b) 细胞类型质心之间的距离:横轴为 PC 空间,纵轴为 UMAP 空间;虚线为 \(y=x\)。(c) 模拟数据中,表达空间 10 近邻之间的扰动响应差异,与随机细胞对的响应差异几乎相同。 | Figure 8. Distances in latent space. (a) PBMC3k: pairwise 30-PC distance versus 2-D UMAP distance for 500 cells. (b) Distances between cell-type centroids in PC space (x) and UMAP space (y); the dashed line is \(y=x\). (c) In the simulation, perturbation-response differences between expression-space neighbours are almost as large as between random cell pairs.
Panel 8a gives 0.80: on PBMC3k the rank correlation between 2-D UMAP distance and 30-PC distance is in fact decent. Panel 8b shows where the problem lies — the ratios are compressed or stretched. The ratio between the farthest and nearest cell-type centroids is Inf in PC space and Inf in UMAP. Ranks survive; scale does not.
This explains a recurring problem in the literature: two clusters “look far apart” on a UMAP, and readers instinctively read that as “these two cell types are very different” — but that distance is one of the prices the optimiser pays to separate clusters.
7.4 表达相似不等于功能相似 / Expression similarity is not functional similarity
Panel 8c is the most important result of this section. Under the same perturbation, the mean response difference between 10-nearest neighbours in expression space is 20.1, against 20.4 for random pairs — less than 2% smaller. The rank correlation between state distance and response distance is only 0.09.
Which means: “these two cells sit next to each other on the plot” does not imply “they will respond the same way to the same intervention.” This is precisely the gap between a representation and a causal model: the former only guarantees observational similarity, the latter demands interventional agreement. Chapter 9 opens that gap up.
8. 跨组学的共同潜在空间 / A Shared Latent Space Across Omics
The same cell can be profiled for transcriptome and surface proteins, but most experiments measure only one. That raises a practical question: if my RNA data and someone else’s protein data come from different cells and different batches, can they be placed in one coordinate system?
8.1 为什么这不是一个平移问题 / Why this is not a translation problem
如果两种模态是同一个潜在状态的线性函数,即 \(x_{\mathrm{RNA}} = A z + \epsilon_1\)、\(x_{\mathrm{prot}} = B z + \epsilon_2\),那么存在一个线性映射 \(T = AB^{-1}\) 把两者对应起来,问题有唯一解(在 \(A, B\) 满秩时)。但现实里至少有三件事破坏了这一点:非线性(饱和、阈值)、模态特异的技术因素(捕获效率、抗体亲和力)、以及没有任何配对样本。
If the two modalities were linear functions of the same latent state — \(x_{\mathrm{RNA}} = Az+\epsilon_1\), \(x_{\mathrm{prot}} = Bz+\epsilon_2\) — then a linear map \(T = AB^{-1}\) would relate them and, with \(A\) and \(B\) of full rank, the solution would be unique. At least three things break this: nonlinearity (saturation, thresholds), modality-specific technical factors (capture efficiency, antibody affinity), and the absence of any paired samples.
The last point is fatal. Without pairing, alignment becomes a problem with distributional constraints but no correspondence constraints, and distributional constraints generally do not pin down the correspondence.
8.2 实验 6:四种对齐策略与一个反例 / Experiment 6: four strategies and one counter-example
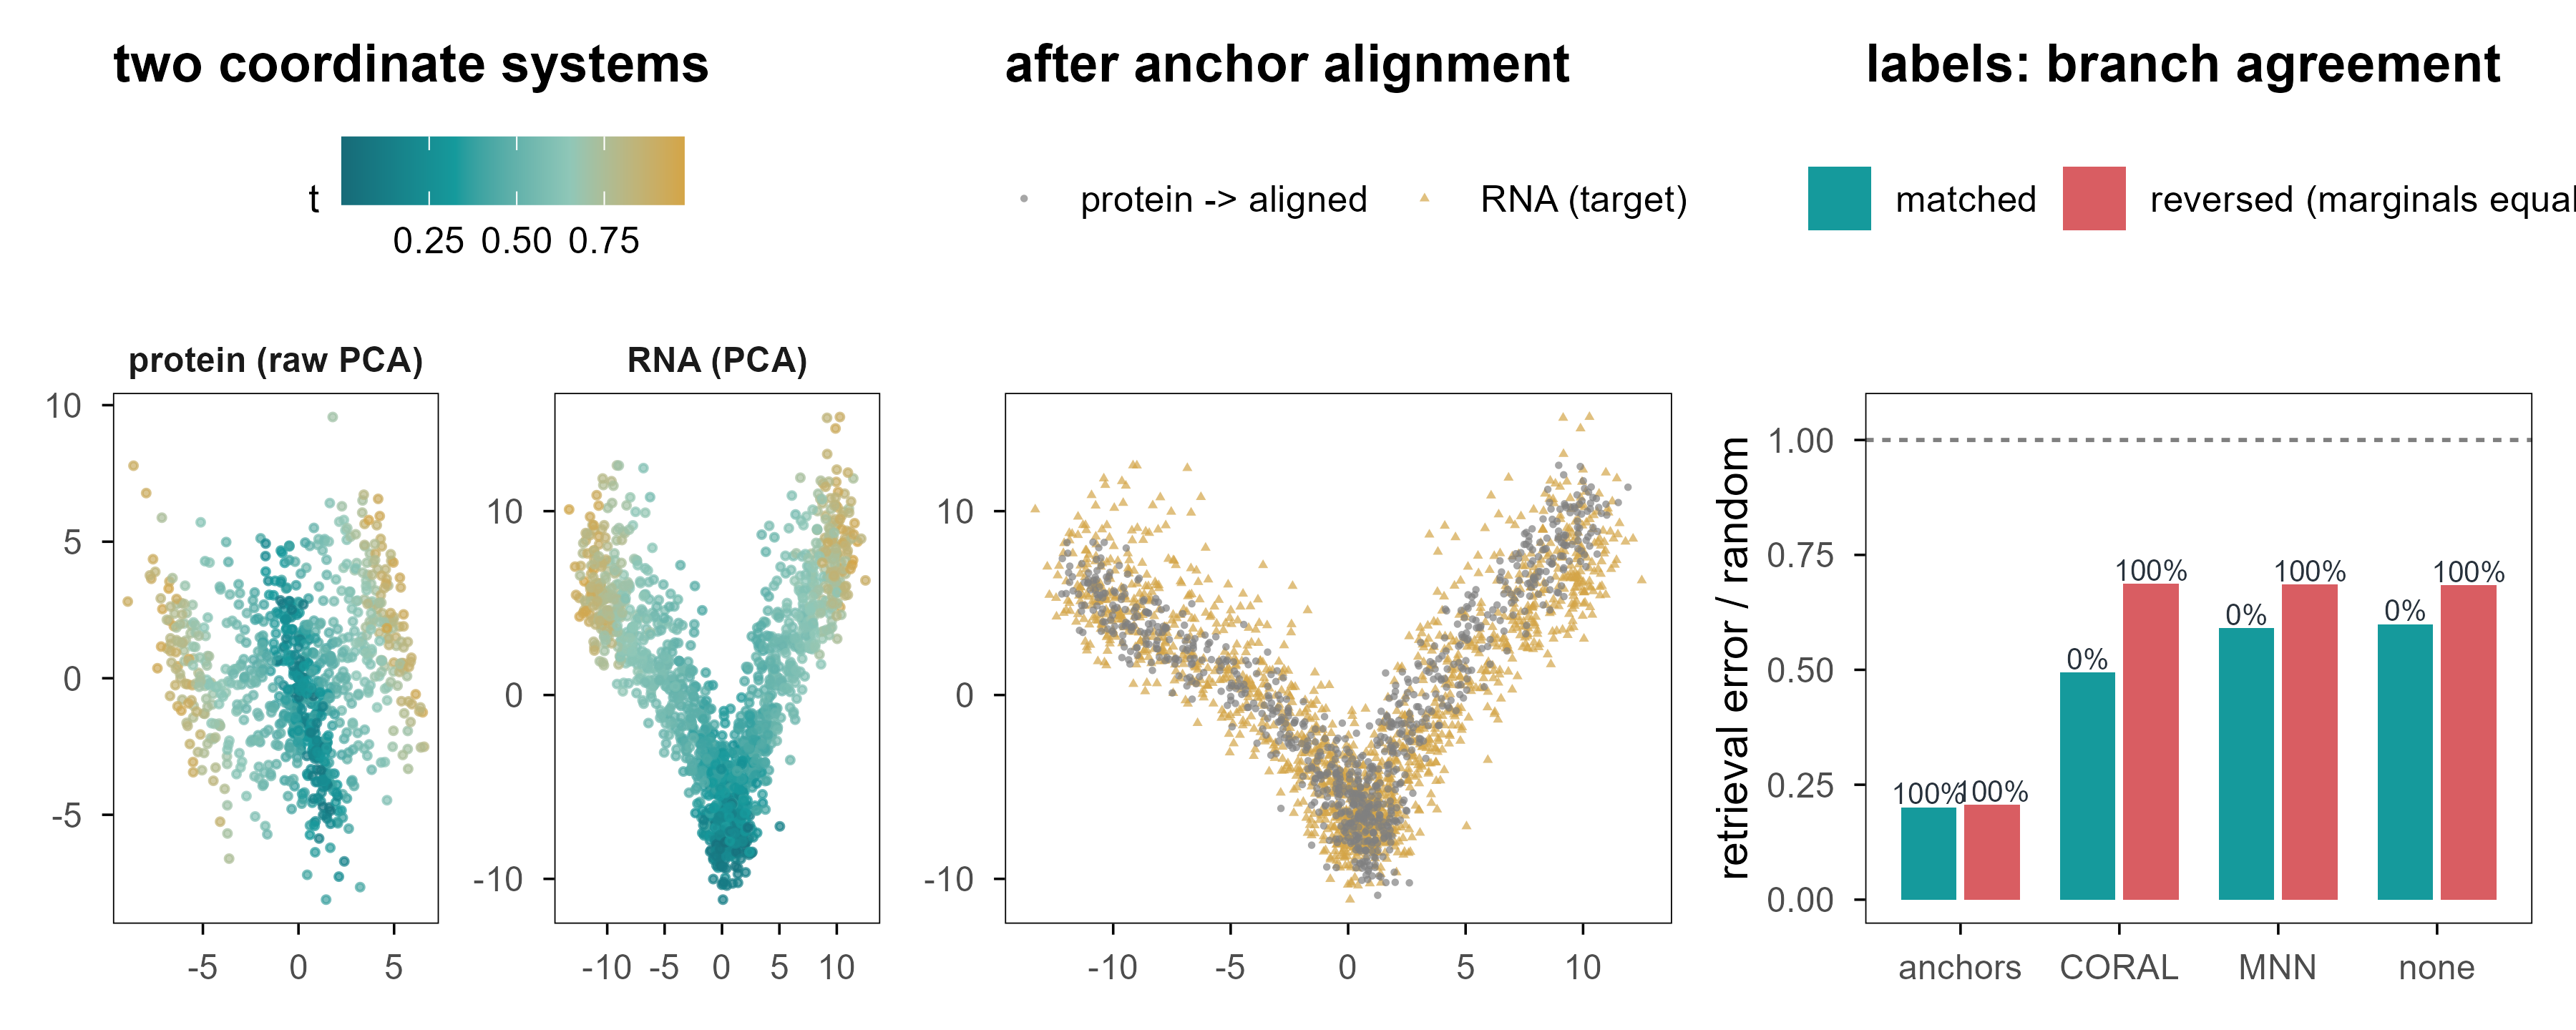
We generate RNA (1,000 genes) and protein (60 markers) from a shared latent state, with disjoint cell sets, plus 60 “anchor” cells measured in both modalities (mimicking sorting or a small multiome subset). The task is retrieval: given a protein cell, find the RNA cell in the same state.
Figure 12: 图 9 两个组学,一个潜在空间?(a) 蛋白模态的 PCA 空间(颜色为真实分化进程)与 RNA 模态的 PCA 空间不是同一个坐标系。(b) 用 60 个锚点细胞拟合线性映射后,蛋白细胞(金色)被放进 RNA 空间。(c) 四种方法的检索误差与分支一致性;右侧一组是「边际分布相同、生物学相反」的反例。 | Figure 9. Two modalities, one latent space? (a) The protein PCA space and the RNA PCA space are different coordinate systems. (b) After fitting a linear map on 60 anchor cells, protein cells (gold) land in RNA space. (c) Retrieval error and branch agreement for four methods; the right-hand group is the counter-example where marginals match but the biology is reversed.
Table 6: 非配对对齐的检索性能。 | Retrieval performance of unpaired alignment.
情景 / scenario
方法 / method
|Δt| / 随机
分支一致 / branch agreement
MMD
对齐 / matched
none
0.60
0%
0.172
对齐 / matched
anchors
0.20
100%
0.005
对齐 / matched
CORAL
0.49
0%
0.019
对齐 / matched
MNN
0.59
0%
0.173
反例 / reversed
none
0.68
100%
0.187
反例 / reversed
anchors
0.21
100%
0.004
反例 / reversed
CORAL
0.69
100%
0.041
反例 / reversed
MNN
0.69
100%
0.183
四个结论:
Four conclusions:
锚点最有效,而且答案稳定。 60 个配对细胞(占目标模态样本的 7%)把检索误差降到随机的 0.20,分支一致性 100%;把同一个流程用在反例上,结果几乎不变(0.21 与 100%)。 Anchors work best and give stable answers. 60 paired cells (7% of the target modality) reduce retrieval error to 0.20 of random with 100% branch agreement; on the counter-example the same pipeline gives 0.21 and 100%.
分布匹配能对齐形状,却把方向搞反了。 CORAL 把 MMD 从 0.172 压到 0.019——分布几乎完全重合——但检索误差仍有随机的 0.49,分支一致性 0%:它把 A 分支的细胞匹配到了 B 分支。 Distribution matching aligns shape and inverts orientation. CORAL pushes MMD from 0.172 to 0.019 — the distributions nearly coincide — yet retrieval error stays at 0.49 of random with 0% branch agreement: it matches branch-A cells to branch-B cells.
朴素 MNN 几乎没用。 在没有尺度归一化的情况下,互相最近邻的配对准确率很低,检索误差仍有随机的 0.59。 Naive MNN barely helps. Without scale normalisation mutual-nearest-neighbour pairing is inaccurate and retrieval error remains 0.59 of random.
反例暴露了符号的不确定性。 把蛋白模态的分支方向反转(边际分布完全不变)之后,CORAL 的分支一致性从 0% 变成 100%——同一个算法,在两个边际分布完全相同的世界里给出了完全相反的答案,而它在两个世界里的 MMD 都低于 0.041。一个输出会随任意符号约定翻转的方法,不能用来给细胞指定身份。 The counter-example exposes sign indeterminacy. Flip the protein branch direction (marginals unchanged) and CORAL’s branch agreement moves from 0% to 100% — the same algorithm gives opposite answers in two worlds with identical marginal distributions, while its MMD stays below 0.041 in both. A method whose output flips with an arbitrary sign convention cannot assign biological identity.
The point is not that CORAL is bad. It is that without paired samples the very notion of “alignment” is under-specified: you need additional structural assumptions (anchors, known matched cell types, shared regulatory modules), and different assumptions yield different, mutually incompatible alignments.
9. 在潜在空间中移动,可以改变细胞吗? / Can We Change a Cell by Moving Through Latent Space?
This is the turning point. Everything so far has been about describing where a cell is; from here we ask whether we can move it somewhere else. Mathematically the two look one step apart (add a vector in latent space); scientifically they are separated by an entire theory of causal inference.
9.1 插值:几何上的直线,生物学的弯路 / Interpolation: a straight line in geometry, a detour in biology
最简单的「移动」是在两个细胞之间插值:
The simplest move is interpolation between two cells:
Every step decodes to a full expression profile and looks very much like differentiation. But there are two traps. First, the straight line is continuous in coordinates, not necessarily on the data manifold. Second, even if it lands on the manifold, the intermediate state need not be biologically realisable.
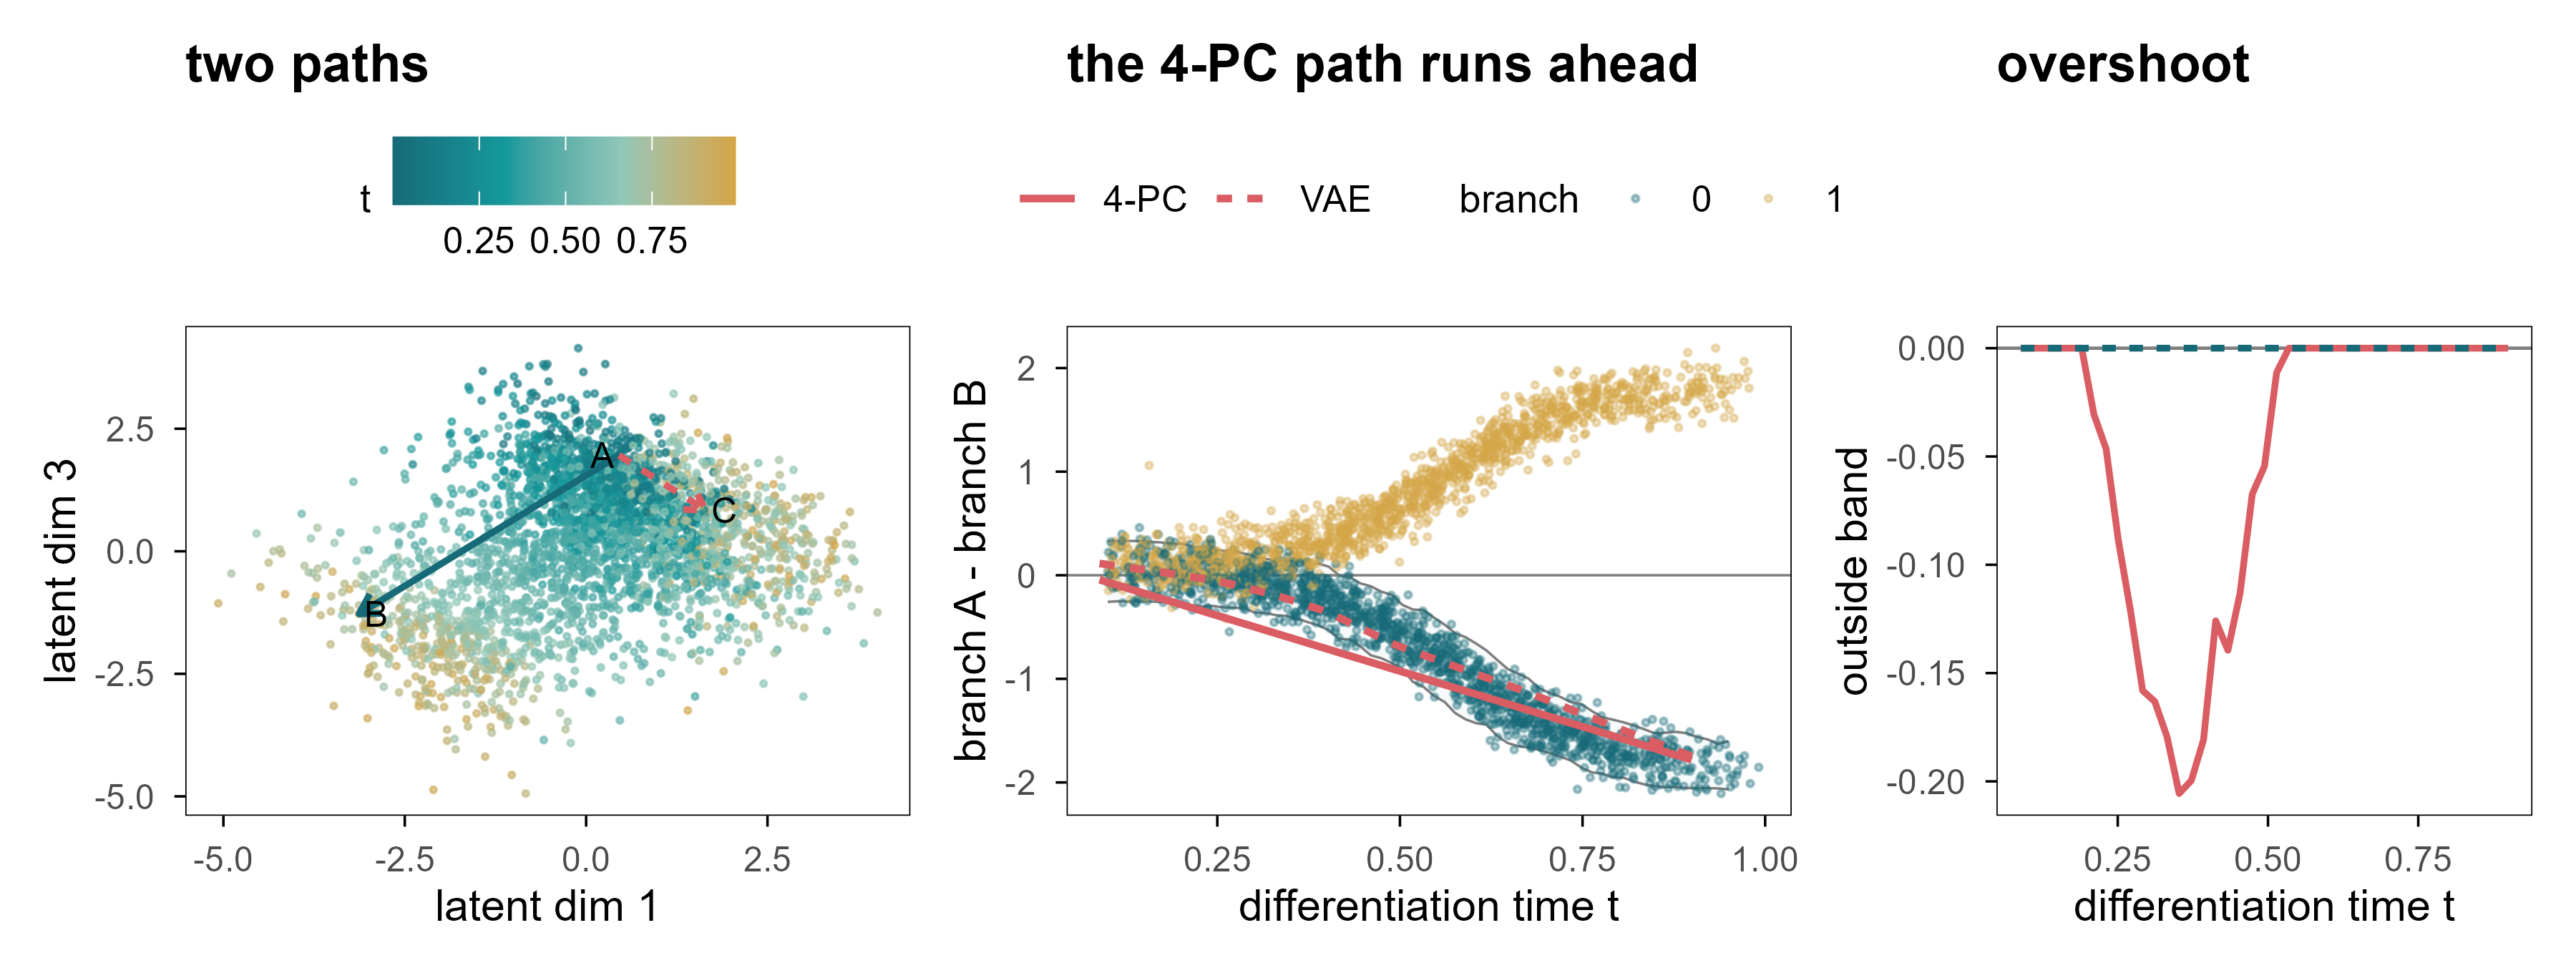
Figure 13: 图 10 最短直线不等于生物学路径。(a) VAE 潜在空间中的两条插值路径:A→B 在同一分支内,A→C 跨分支。(b) 真实细胞的「A 模块减 B 模块」对比随 \(t\) 的变化(点为真实细胞,颜色为分支);灰带是同一时刻、目标分支真实细胞的 5–95% 区间。红色为插值路径(实线 4 维 PCA 解码器,点线 VAE 解码器):两条路径最终都到达目标分支,但 4-PC 路径在中间段提前冲出灰带。(c) 两条路径偏离灰带(即真实细胞 5–95% 区间)的距离:VAE 全程为 0,4-PC 在中间段出现明显偏离。 | Figure 10. The shortest line is not a biological path. (a) Two interpolation paths in the VAE latent space: A→B within a branch, A→C across branches. (b) The branch-A-minus-branch-B contrast against \(t\) for real cells (points, coloured by branch); the grey ribbon is the 5–95% range of real cells at the same time in the target branch. Red lines are the interpolated paths (solid: 4-PC decoder, dotted: VAE). Both paths arrive at the correct branch, but the 4-PC path overshoots the ribbon in the middle. (c) Distance from every point of the path to the admissible band (the 5–95% range of real cells): the VAE stays at zero throughout, the 4-PC path departs from it in the middle.
图 10b 给出一个比「偏离流形」更微妙的失败。真实细胞在 \(t \approx 0.6\) 之后分成两支:一支 A 高 B 低,一支相反,中间几乎是空的。两条插值路径最终都到达了正确的分支——4 维 PCA 解码器在终点给出 -1.78,同一时刻真实细胞的 5–95% 区间是 -2.05 到 -1.55。只看终点,插值完全成功。
Panel 10b shows a subtler failure than “leaving the manifold”. After \(t \approx 0.6\) real cells split into two arms - A high and B low, or the reverse - and the middle is almost empty. Both paths do arrive at the correct branch: the 4-PC decoder ends at -1.78, while real cells at the same time span -2.05 to -1.55. Judged only by its endpoint, the interpolation is a complete success.
The problem lies in the middle. Real commitment is not uniform in time: \(w(t)\) rises steeply around \(t \approx 0.6\), so early cells carry almost no branch signature and late cells are almost fully determined. A straight line in latent space makes commitment grow linearly in \(\alpha\). The consequence is that over \(t \in [0.25, 0.5]\) the path leaves the ribbon: it describes a cell that is halfway through differentiation yet already expresses a terminal branch programme, and no such cell exists among the 3,000 real ones. 39% of the path falls outside the interval, with a maximum excursion of 0.21. Notably, the VAE path stays inside the ribbon throughout — which shows that passing this test does not prove a trajectory is biological; it merely fails to make this particular mistake.
Panel 10c draws the excursion directly: the 4-PC path sits steadily below the ribbon between \(t \approx 0.25\) and \(0.5\), while the VAE path hugs zero throughout. What makes it worse is that none of these points is floating in space — their mean distance to the nearest real cell is only 0.67 times a real cell’s own nearest-neighbour distance. A cell that is halfway through differentiation yet already expressing a terminal programme therefore sits in the centre of the cloud, surrounded by real cells. That is the most dangerous case of all: an obviously absurd generation is caught immediately, whereas a perfectly plausible-looking intermediate profile is not.
9.2 外推比插值危险得多 / Extrapolation is far more dangerous than interpolation
Interpolation at least has two endpoints as constraints. Extrapolation has none: push \(z\) outside the data distribution and the decoder still returns a plausible-looking profile, because it is a function defined on all of \(\mathbb{R}^4\). A generative model will not tell you “there is no data here” unless you ask explicitly.
9.3 扰动:从「移动一个点」到「改变一个机制」 / Perturbation: from moving a point to changing a mechanism
A genuinely biological “move” comes from an intervention: knock out a gene, activate a pathway, add a drug. We simulated three perturbations whose effects all depend on cell state:
Note \(h_{u_2}\): it changes sign at \(t \approx 0.67\). The same knockout lowers a module in early cells and raises it in late cells. This is not a contrived trap; it happens in real systems, for instance when the same transcription factor binds different enhancers in different states.
We compare three strategies: a fixed response vector (ignoring state), neighbour averaging (average response of observed cells with similar state), and a linear model with state-by-perturbation interactions.
Table 7: 状态依赖扰动的预测性能(留出细胞)。 | Prediction of state-dependent perturbation responses on held-out cells.
情景 / scenario
方法 / method
cos
R²
幅度比 / magnitude
u1
fixed
0.58
0.30
0.60
u1
kNN
0.56
0.30
0.60
u1
interaction
0.58
0.32
0.59
u2
fixed
0.56
0.28
0.56
u2
kNN
0.54
0.27
0.60
u2
interaction
0.55
0.29
0.58
u3
fixed
0.70
0.44
0.70
u3
kNN
0.68
0.43
0.71
u3
interaction
0.69
0.44
0.70
u2 (late, extrapolation)
fixed
-0.29
-0.79
0.64
u2 (late, extrapolation)
kNN
-0.26
-0.48
0.47
u2 (late, extrapolation)
interaction
-0.03
-0.18
0.40
u4 (unseen)
interaction
-0.09
-0.17
0.24
u4 (unseen)
null (0)
0.00
-0.06
0.00
三个结果值得逐条读:
Three results deserve a close read:
在观测覆盖的范围内,三种方法差不多。 u1、u2、u3 的 cos 都在 0.54–0.70。这说明:当干预覆盖了状态空间、且效应平滑时,复杂模型并不带来多少额外收益。 Within the observed range the three methods are similar: cos between 0.54 and 0.70. When the intervention covers the state space and the effect is smooth, the complex model buys little.
一旦离开覆盖范围,固定向量会给出错误的方向。 对 u2 的晚期细胞,固定向量的 cos 是 -0.29,即方向完全相反。近邻法也好不到哪里去(-0.26),因为它在早期细胞里找不到可用的邻居。 Once outside the covered range, the fixed vector points the wrong way. For late u2 cells its cos is -0.29, i.e. the opposite direction. Neighbour averaging is no better (-0.26), because it cannot find usable neighbours among early cells.
交互模型只能外推一小段。 它在 u2 晚期上的 cos 是 -0.03,R² 仍然是负的:线性外推在符号变化点附近还可以,但幅度完全错了。对从未观测过的 u4,所有方法都失败(cos -0.09,R² -0.17)。 The interaction model extrapolates a little: cos -0.03 on late u2 cells, but R² stays negative — linear extrapolation gets the sign roughly right near the crossing point and the magnitude completely wrong. For the never-observed u4 every method fails (cos -0.09, R² -0.17).
Code
vf <- e7$vfield# normalise arrow lengths so the direction is visible on the cell scalesc <-1.2/max(sqrt(vf$dx^2+ vf$dy^2))cell_df <-tibble(z1 = e7$Z[, 1], z2 = e7$Z[, 2], t = e7$truth$t)p <-plot_ly()for (k inseq_along(c("u1", "u2"))) { u <-c("u1", "u2")[k] d <- vf[vf$u == u, ] p <- p |>add_segments(data = d, x =~z1, y =~z2, xend =~z1 + dx * sc, yend =~z2 + dy * sc,line =list(color =if (k ==1) "#159A9C"else"#D95D62", width =3),visible = (k ==1), name = u, showlegend =FALSE,inherit =FALSE)}p <- p |>add_markers(data = cell_df, x =~z1, y =~z2, marker =list(size =2, color ="rgba(150,160,165,0.30)"),name ="cells", hoverinfo ="skip") |>layout(xaxis =list(title ="PC1 (branch)"), yaxis =list(title ="PC2 (time)"),paper_bgcolor ="rgba(0,0,0,0)", plot_bgcolor ="rgba(0,0,0,0)",updatemenus =list(list(type ="buttons", direction ="right", x =0.5, xanchor ="center", y =1.15,buttons =list(list(label ="u1 (late-acting)", method ="update",args =list(list(visible =c(TRUE, FALSE, TRUE)), list(title ="u1: effect grows with t"))),list(label ="u2 (sign flip)", method ="update",args =list(list(visible =c(FALSE, TRUE, TRUE)), list(title ="u2: effect flips sign at t ~ 0.67"))) ) )),title ="u1: effect grows with t")p
Figure 14: 图 11(交互) 状态依赖的扰动向量场。背景为细胞的潜在状态(PC1–PC2),箭头为该状态下预测的响应方向;点击按钮切换扰动。注意 u2 的箭头随位置翻转。 | Figure 11 (interactive). The state-dependent perturbation vector field. The background shows latent states (PC1-PC2); arrows give the predicted response direction at that state. Use the buttons to switch perturbation. Note that the u2 arrows flip direction along the trajectory.
图 11 里最值得看的是 u2 的箭头:它沿着分化轴逐渐缩短、然后反向。任何「用一个统一的扰动向量描述某个基因的作用」的做法,都会在这个图上暴露出问题。
The arrows worth watching in Figure 11 are those for u2: they shorten along the differentiation axis and then reverse. Any approach that describes a gene’s effect with one global perturbation vector is exposed by this picture.
9.4 状态转移函数需要什么 / What a state-transition function would need
如果想更进一步,从「预测某个状态下的响应」到「预测状态如何随时间演化」,需要的是一个动力系统:
Going further — from “predict the response at a state” to “predict how the state evolves in time” — requires a dynamical system:
Every term in this equation has a cost. \(F_\theta\) needs training on interventional time series, which are rare; \(\Delta t\) is usually unobservable in real data (we substitute pseudotime, which is not time); and \(g_\phi\) must map latent states back to measurable observations, reintroducing every error discussed above.
更根本的是,一个能在观测数据上完美拟合的 \(F_\theta\),可以在多个机制上等价。观测上的差异不等于因果上的干预:把两个状态的差异写成 \(\Delta x = x_1 - x_0\),这只告诉我们「它们不同」,不告诉我们「是什么让它们不同」。
More fundamentally, an \(F_\theta\) that fits observational data perfectly can be consistent with several mechanisms. Observational difference is not causal intervention: writing the difference between two states as \(\Delta x = x_1 - x_0\) tells us that they differ, not what makes them differ.
10. 从潜在空间到虚拟细胞 / From Latent Representations to Virtual Cells
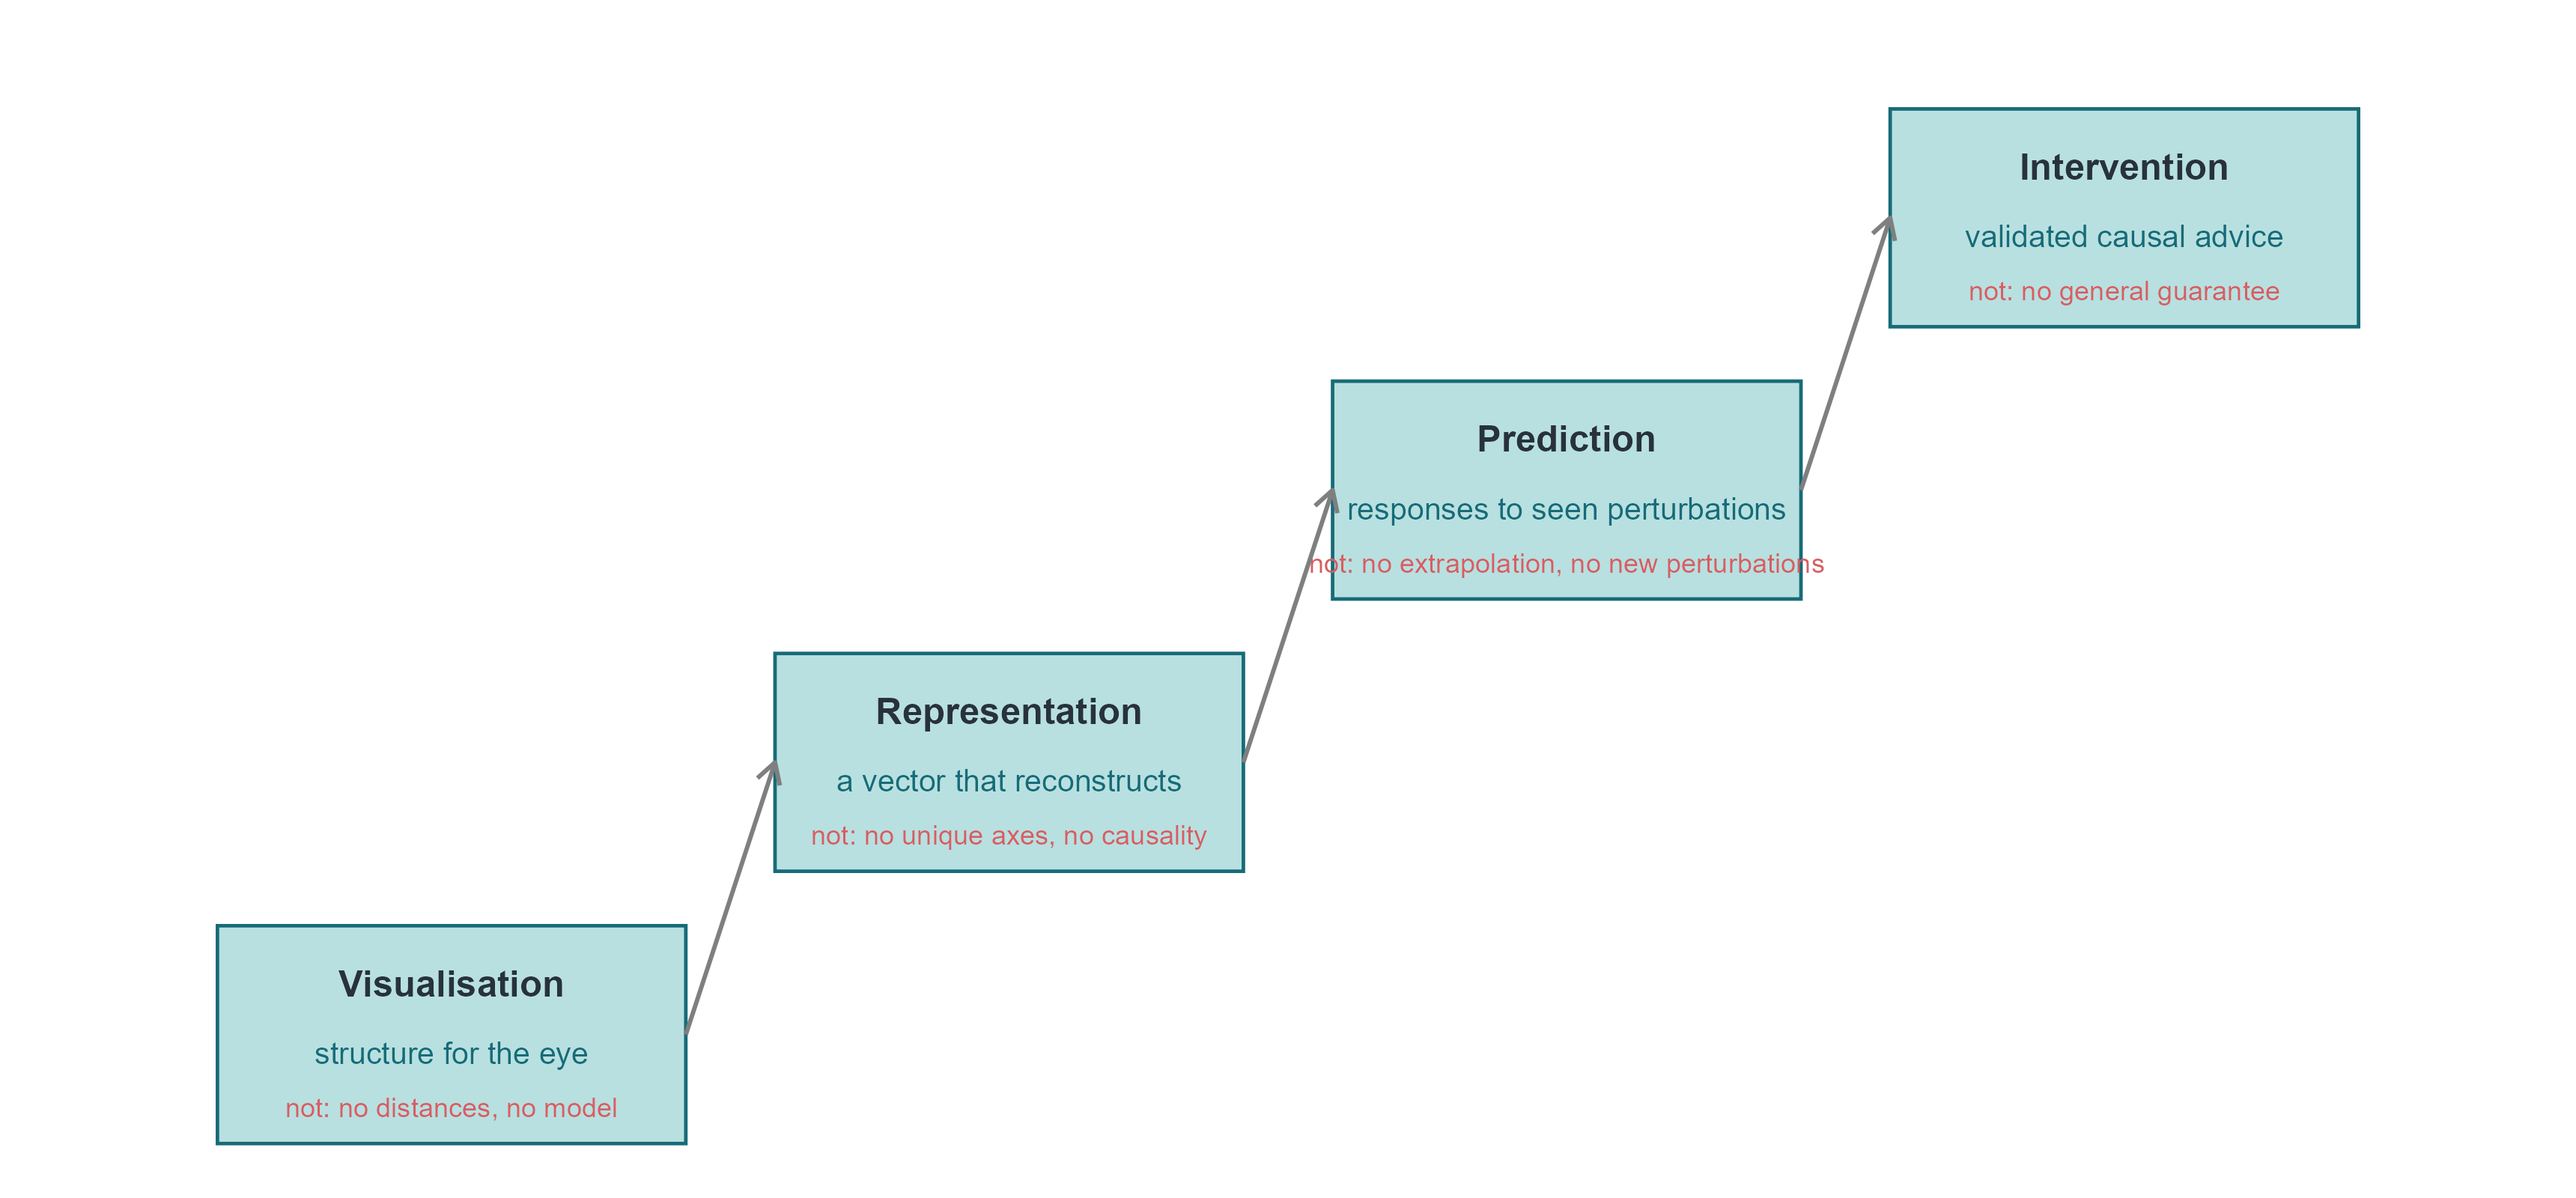
10.1 四个层次,四种承诺 / Four levels, four promises
「虚拟细胞」这个词被用来指代差别极大的东西。把它们分成四个层次,可以避免很多混淆:
The phrase “virtual cell” is used for very different things. Separating four levels avoids much confusion:
可视化(visualisation):把细胞放到二维图上,帮助人眼发现结构。承诺很弱,也最容易兑现。 Putting cells on a 2-D map so the eye can find structure. A weak promise, and the easiest to keep.
表征(representation):得到一个可以重建、可以度量、可以迁移到下游任务的向量。承诺中等,需要独立的测试集。 A vector that reconstructs, measures and transfers to downstream tasks. A medium promise, requiring independent test sets.
预测(prediction):给定状态与干预,预测新的观测。承诺很强,需要干预数据与 OOD 检验。 Given a state and an intervention, predict new observations. A strong promise, requiring interventional data and out-of-distribution tests.
干预(intervention):给出的建议能被实验验证,并且能推广到未见过的细胞类型与扰动组合。承诺最强,目前几乎没有系统性的成功案例。 Advice that survives experimental validation and generalises to unseen cell types and perturbation combinations. The strongest promise, with almost no systematic successes so far.
Code
qA <- e2$metrics |>filter(key !="genes_direct")pA <-ggplot(qA, aes(knn, r_t)) +geom_point(size =2, colour = cell_pal[["teal"]]) +geom_smooth(method ="lm", se =FALSE, linewidth =0.4, colour = cell_pal[["grey"]]) +labs(x ="10-NN preservation", y ="Spearman with t", title ="UMAP settings")qB <-bind_rows(tibble(model ="AE", d = e4$nn$d[e4$nn$model =="AE"], mse = e4$nn$test_mse[e4$nn$model =="AE"],r_t = e4$nn$r_t[e4$nn$model =="AE"]),tibble(model ="VAE", d = e4$nn$d[e4$nn$model =="VAE"], mse = e4$nn$test_mse[e4$nn$model =="VAE"],r_t = e4$nn$r_t[e4$nn$model =="VAE"]))pB <-ggplot(qB, aes(mse, r_t, colour = model, label = d)) +geom_text(size =3) +scale_colour_manual(values =c(AE = cell_pal[["deep"]], VAE = cell_pal[["gold"]]), name =NULL) +labs(x ="test reconstruction MSE", y ="Spearman with t", title ="AE / VAE (label = d)")qC <- e7$respC <-ggplot(qC, aes(scenario, r2, fill = method)) +geom_col(position =position_dodge(width =0.8), width =0.7) +geom_hline(yintercept =0, colour = cell_pal[["grey"]], linewidth =0.3) +scale_fill_manual(values =c(fixed = cell_pal[["grey"]], kNN = cell_pal[["gold"]],interaction = cell_pal[["teal"]], `null (0)`="#DDDDDD"), name =NULL) +labs(x =NULL, y ="R² of predicted response", title ="perturbation prediction") +theme(axis.text.x =element_text(angle =30, hjust =1, size =rel(0.75)))(pA + pB + pC) +plot_layout(widths =c(1, 1, 1.4))
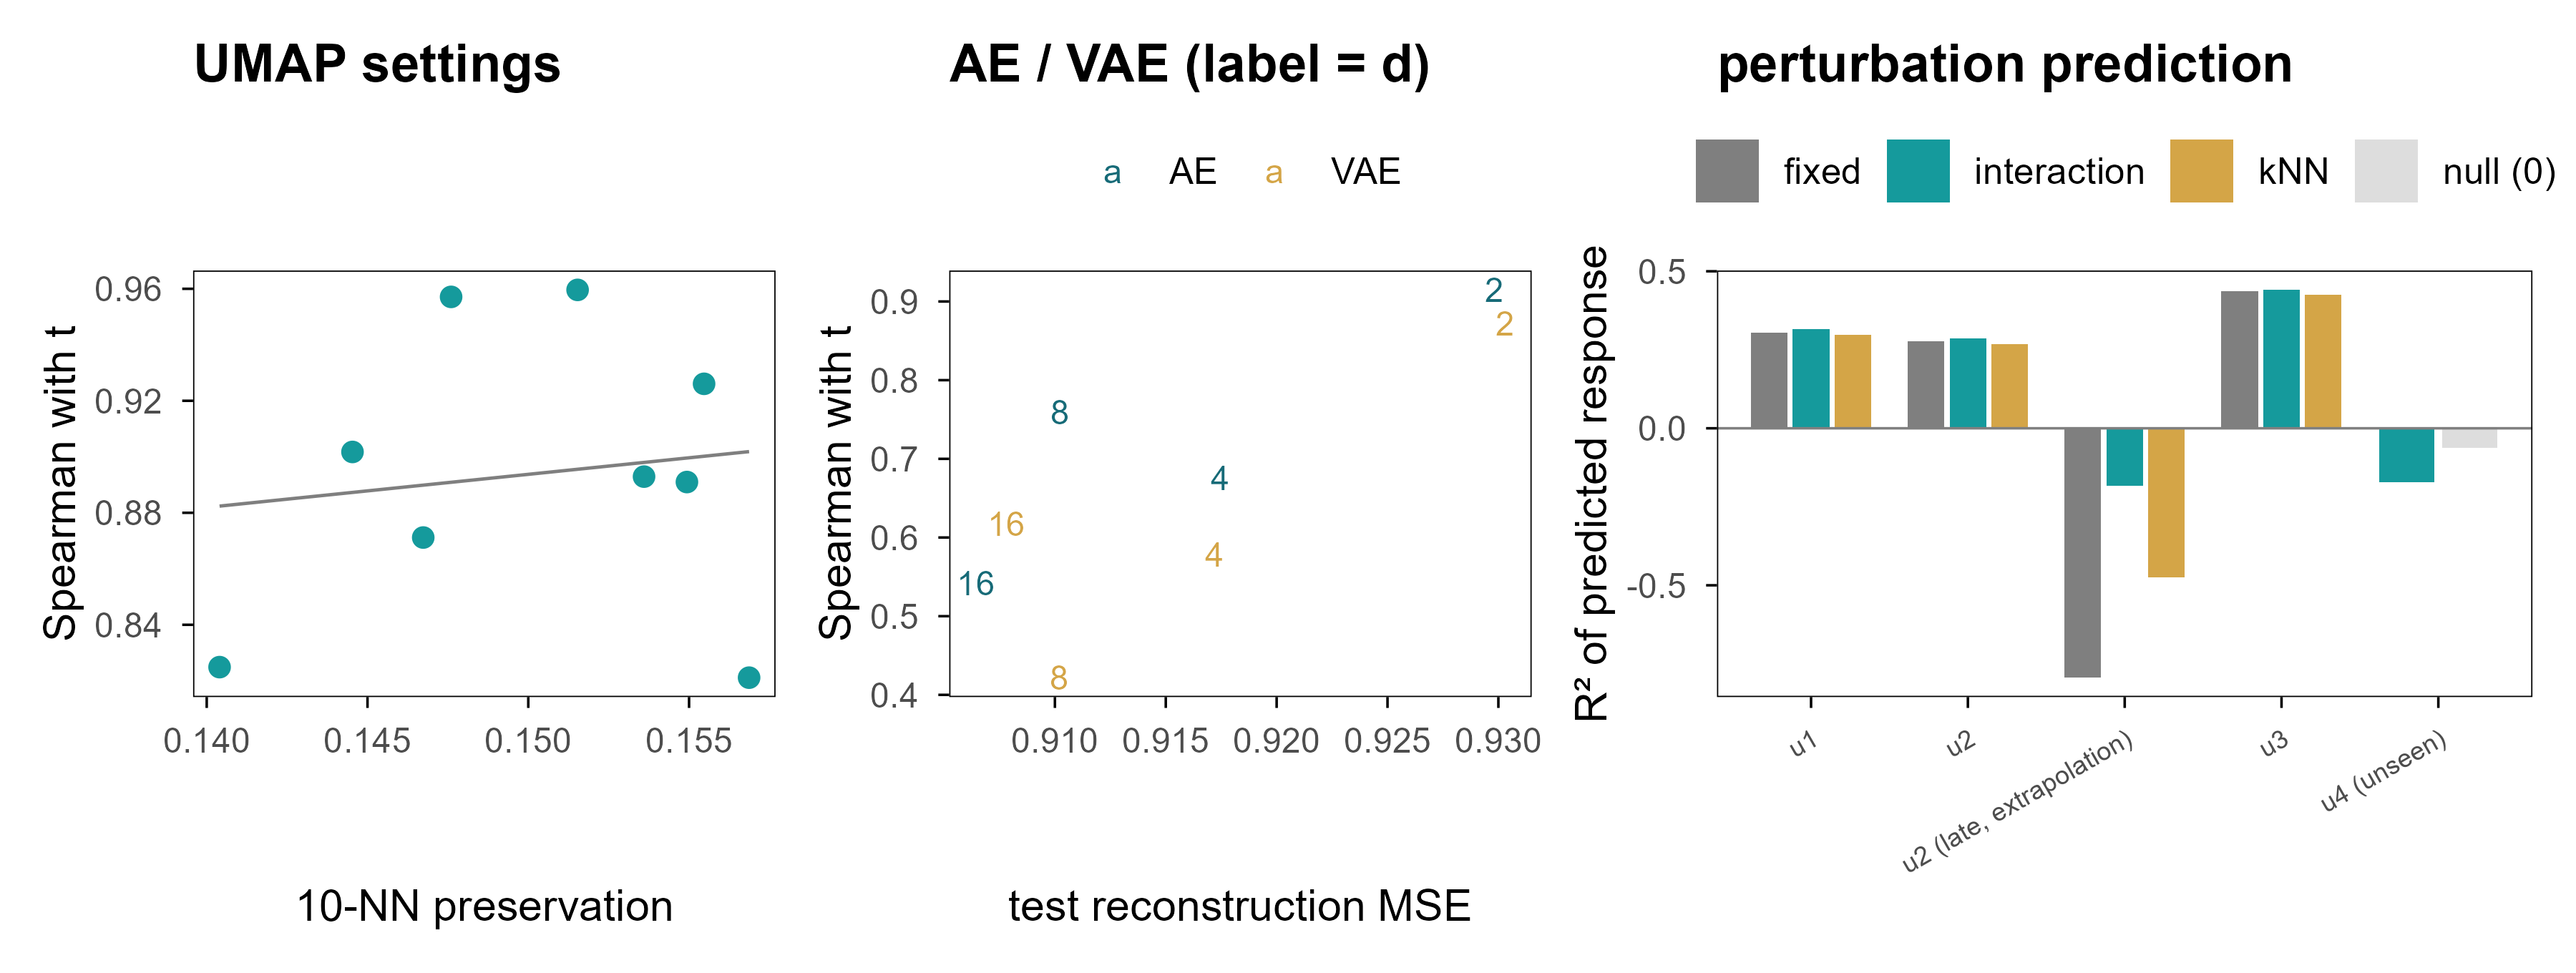
Figure 15: 图 12 「看起来好」与「预测得好」是两件不同的事。(a) 九组 UMAP 参数的近邻保持率与 \(t\) 恢复之间几乎没有关系。(b) 自编码器 / VAE 的重建误差越低,并不代表状态恢复越好:d = 2 的重建最差,却常常是 \(t\) 恢复最好的。(c) 扰动预测:在覆盖范围内 cos 很高,一旦外推 R² 立刻转负。 | Figure 12. Looking good and predicting well are different things. (a) Across nine UMAP settings there is almost no relation between neighbourhood preservation and recovery of \(t\). (b) Lower reconstruction error does not mean better state recovery: d = 2 reconstructs worst yet is often best for \(t\). (c) Perturbation prediction: cosine is high inside the covered range and R² turns negative as soon as we extrapolate.
三个面板说的是同一件事的三个方面:评价指标与目标能力之间没有必然联系。近邻保持率高的嵌入不一定恢复时间;重建误差低的模型不一定有可用的潜在坐标;在训练分布内 cos 很高的扰动模型,出了分布就失效。
The three panels say the same thing in three ways: the metric and the capability are not the same thing. An embedding with high neighbour preservation need not recover time; a model with low reconstruction error need not have usable latent coordinates; a perturbation model with high cosine inside the training distribution can fail immediately outside it.
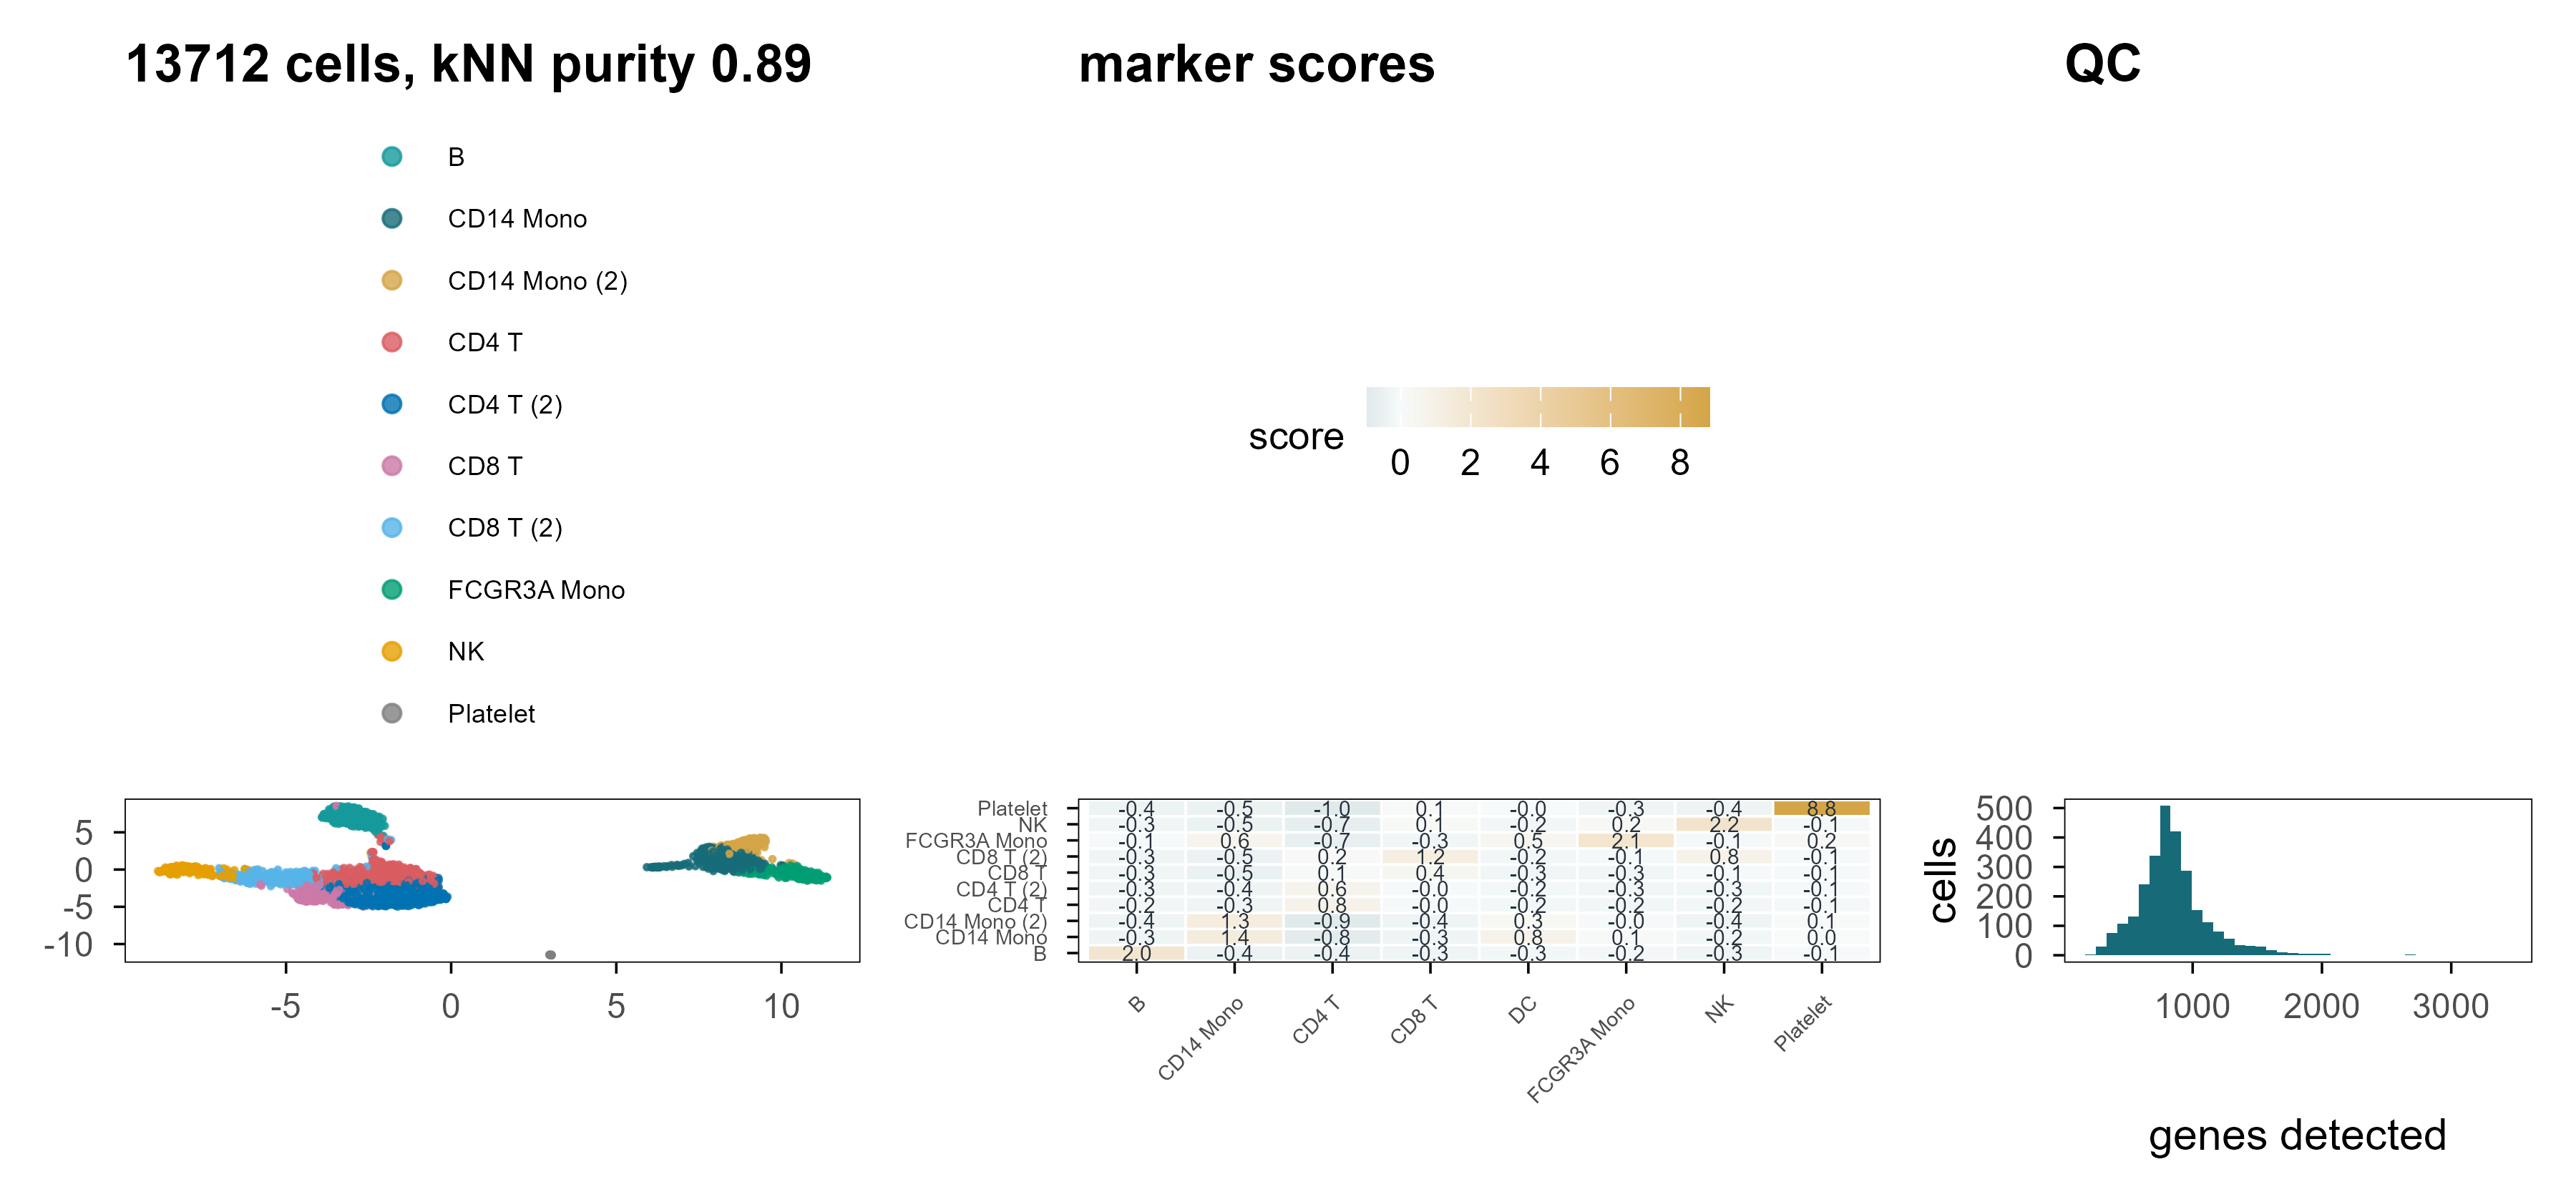
Figure 16: 图 13 PBMC3k 上的重复。(a) UMAP,颜色为 marker 打分 + k-means 得到的标签(不是金标准)。(b) 四个标记基因的表达。(c) 原始数据的 QC 分布。 | Figure 13. The same analysis on PBMC3k. (a) UMAP coloured by marker-score plus k-means labels (not a ground truth). (b) Expression of four marker genes. (c) QC distributions of the raw data.
在真实数据上,我们没有金标准,所以只能报告相对指标:kNN 标签纯度 0.89(这是在 PC 空间里用同一批标记算出来的,因此偏高)、PC1–10 解释 14.6% 的方差、UMAP 距离与 PC 距离的相关 0.80。这些数字能说明流程是自洽的,但不能说明标签是对的。这是真实数据与模拟数据最本质的差别:前者没有答案可以对照。
On real data we have no ground truth, so only relative metrics can be reported: kNN label purity 0.89 (computed in PC space with the same markers, hence optimistic), 14.6% of variance in PC1-10, and a UMAP-to-PC distance correlation of 0.80. These numbers show the pipeline is self-consistent; they do not show the labels are right. That is the essential difference between real and simulated data: the former offers nothing to check against.
10.3 下一代虚拟细胞需要什么 / What the next generation of virtual cells would need
把前九章的结论收拢,一个真正有用的细胞表征至少需要四件事,而目前的工具往往只提供其中一两件:
Pulling the previous nine chapters together, a genuinely useful cell representation needs at least four things, and current tools usually provide only one or two:
对干预稳定的坐标。 潜在维度应当在不同的扰动、批次、测序深度下保持含义不变。目前没有任何非监督方法能保证这一点。 Coordinates stable under intervention. Latent dimensions should keep their meaning across perturbations, batches and depths. No unsupervised method currently guarantees this.
显式的不确定性。 一个细胞状态是一个分布,不是一个点。VAE 提供了这个框架,但标准高斯先验常常与真实的后验形状不匹配。 Explicit uncertainty. A cell state is a distribution, not a point. VAEs provide the framework, but a standard Gaussian prior often mismatches the real posterior.
机制约束。 基因调控网络、通路成员关系、代谢约束,都可以作为先验注入模型,减少「看起来合理但不可能」的解。 Mechanistic constraints. Regulatory networks, pathway membership and metabolic constraints can be injected as priors, ruling out solutions that look plausible but are impossible.
干预数据的规模。 这是最硬的一条限制。没有足够多、覆盖足够广的扰动实验,任何「虚拟细胞」都只是在观测分布内插值。 Scale of interventional data. This is the hardest constraint. Without enough perturbation experiments covering enough of state space, any “virtual cell” is only interpolating inside the observed distribution.
Code
lad <-tibble(level =factor(c("Visualisation", "Representation", "Prediction", "Intervention"),levels =c("Visualisation", "Representation", "Prediction", "Intervention")),x =1:4, y =c(0, 0.9, 1.8, 2.7),gives =c("structure for the eye", "a vector that reconstructs","responses to seen perturbations", "validated causal advice"),not =c("no distances, no model", "no unique axes, no causality","no extrapolation, no new perturbations", "no general guarantee"))ggplot(lad, aes(x, y)) +geom_rect(aes(xmin = x -0.42, xmax = x +0.42, ymin = y, ymax = y +0.72),fill = cell_pal[["teal"]], alpha =0.30,colour = cell_pal[["deep"]], linewidth =0.4) +geom_text(aes(label = level), y = lad$y +0.53, size =3.1, fontface ="bold", colour = cell_pal[["ink"]]) +geom_text(aes(label = gives), y = lad$y +0.30, size =2.6, colour = cell_pal[["deep"]]) +geom_text(aes(label =paste("not:", not)), y = lad$y +0.12, size =2.3, colour = cell_pal[["red"]]) +annotate("segment", x =1.42, xend =1.58, y =0.36, yend =1.26,arrow =arrow(length =unit(2, "mm")), colour = cell_pal[["grey"]]) +annotate("segment", x =2.42, xend =2.58, y =1.26, yend =2.16,arrow =arrow(length =unit(2, "mm")), colour = cell_pal[["grey"]]) +annotate("segment", x =3.42, xend =3.58, y =2.16, yend =3.06,arrow =arrow(length =unit(2, "mm")), colour = cell_pal[["grey"]]) +coord_cartesian(xlim =c(0.4, 4.6), ylim =c(0, 3.6)) +theme_void()
Figure 17: 图 14 从嵌入到虚拟细胞:四个层次,以及每一层「不能保证」的东西。 | Figure 14. From embedding to virtual cell: four levels and what each of them does not guarantee.
10.4 回到开头的问题 / Back to the opening question
现在可以回答开头那个问题了:我们是在发现生物学的潜在空间,还是在构造一个恰好对模型有用的潜在空间?
We can now answer the question posed at the start: are we discovering the latent space of biology, or constructing a latent space that happens to be useful for our models?
这篇文章的证据支持一个分两半的答案。
The evidence in this article supports a two-part answer.
发现的部分是真的。 当数据里确实存在低维结构时(我们的模拟是这样,Swiss roll 是这样,PBMC 的细胞类型结构也是这样),不同的方法会收敛到相似的结构:PCA 的第二主成分、Diffusion Map 的第二个分量、VAE 的某一个潜在维度,都能跟踪同一条分化轴。这说明结构在数据里,不在算法里。
The discovery part is real. When low-dimensional structure genuinely exists — in our simulation, on the Swiss roll, and in the cell-type structure of PBMC — different methods converge on similar structure: PC2, the second diffusion component and one VAE latent dimension all track the same differentiation axis. The structure is in the data, not in the algorithm.
The construction part is also real. The scale of distances, the separation of clusters, the rotation of latent axes, and the intermediate states along an interpolation path are not given by the data but by the model. Chapters 4, 5, 7 and 9 quantified how far each of them drifts from the truth.
The two are not contradictory. A map reflects both the terrain and the choices of its maker. The question is not whether construction happens, but whether the constructed part is labelled as such: report the distance from an interpolated path to the data cloud, report the distortion of inter-cluster distances, report the region where extrapolation fails.
我们的目标不仅是寻找细胞的低维表示,而是寻找能够保留理解、预测并最终干预生物系统所需信息的表征。
The goal is not merely to find a low-dimensional representation of cells, but to discover representations that preserve the information necessary to understand, predict, and eventually intervene in biological systems.
By that standard, every method shown here is only a first step. They help us see, partly help us reconstruct, rarely help us predict, and almost never help us intervene. The next stretch of the road probably lies not in dimensionality-reduction algorithms but in the design of perturbation experiments.
参考文献 / References
Jolliffe, I. T. & Cadima, J. (2016). Principal component analysis: a review and recent developments. Philosophical Transactions of the Royal Society A 374, 20150202. doi:10.1098/rsta.2015.0202
McInnes, L., Healy, J. & Melville, J. (2018). UMAP: Uniform Manifold Approximation and Projection for Dimension Reduction. arXiv 1802.03426. https://arxiv.org/abs/1802.03426
Becht, E., et al. (2019). Dimensionality reduction for visualizing single-cell data using UMAP. Nature Biotechnology 37, 38–44. doi:10.1038/nbt.4314
Coifman, R. R. & Lafon, S. (2006). Diffusion maps. Applied and Computational Harmonic Analysis 21, 5–30. doi:10.1016/j.acha.2006.04.006
Haghverdi, L., Buettner, F. & Theis, F. J. (2015). Diffusion maps for high-dimensional single-cell analysis of differentiation data. Bioinformatics 31, 2989–2998. doi:10.1093/bioinformatics/btv325
Tenenbaum, J. B., de Silva, V. & Langford, J. C. (2000). A global geometric framework for nonlinear dimensionality reduction. Science 290, 2319–2323. doi:10.1126/science.290.5500.2319
Rezende, D. J., Mohamed, S. & Wierstra, D. (2014). Stochastic backpropagation and approximate inference in deep generative models. ICML. https://arxiv.org/abs/1401.4082
Lopez, R., Regier, J., Cole, M. B., Jordan, M. I. & Yosef, N. (2018). Deep generative modeling for single-cell transcriptomics. Nature Methods 15, 1053–1058. doi:10.1038/s41592-018-0229-2
Gayoso, A., et al. (2022). A Python library for probabilistic analysis of single-cell omics data. Nature Biotechnology 40, 163–166. doi:10.1038/s41587-021-01206-w
Argelaguet, R., et al. (2021). Computational principles and challenges in single-cell data integration. Nature Biotechnology 39, 1202–1215. doi:10.1038/s41587-021-00895-6
Korsunsky, I., et al. (2019). Fast, sensitive and accurate integration of single-cell data with Harmony. Nature Methods 16, 1289–1296. doi:10.1038/s41592-019-0619-0
Hie, B., Bryson, B. & Berger, B. (2019). Efficient integration of heterogeneous single-cell transcriptomes using Scanorama. Nature Biotechnology 37, 685–691. doi:10.1038/s41587-019-0113-3
Lotfollahi, M., Wolf, F. A. & Theis, F. J. (2019). scGen predicts single-cell perturbation responses. Nature Methods 16, 715–721. doi:10.1038/s41592-019-0494-8
Roohani, Y., Huang, K. & Leskovec, J. (2024). Predicting transcriptional outcomes of novel multigene perturbations with GEARS. Nature Biotechnology 42, 927–935. doi:10.1038/s41587-023-01905-6
Bunne, C., et al. (2023). Learning single-cell perturbation responses using neural optimal transport. Nature Methods 20, 1759–1768. doi:10.1038/s41592-023-01969-x
Norman, T. M., et al. (2019). Exploring genetic interaction manifolds constructed from rich single-cell phenotypes. Science 365, 786–793. doi:10.1126/science.aax4438
Replogle, J. M., et al. (2022). Mapping information-rich genotype-phenotype landscapes with genome-scale Perturb-seq. Cell 185, 2559–2575. doi:10.1016/j.cell.2022.05.013
Theodoris, C. V., et al. (2023). Transfer learning enables predictions in network biology. Nature 618, 616–624. doi:10.1038/s41586-023-06139-9
Bengio, Y., Courville, A. & Vincent, P. (2013). Representation learning: a review and new perspectives. IEEE TPAMI 35, 1798–1828. doi:10.1109/TPAMI.2013.50
Hastie, T., Tibshirani, R. & Friedman, J. (2009). The Elements of Statistical Learning, 2nd ed. Springer. doi:10.1007/978-0-387-84858-7
Luecken, M. D. & Theis, F. J. (2019). Current best practices in single-cell RNA-seq analysis: a tutorial. Molecular Systems Biology 15, e8746. doi:10.15252/msb.20188746
引用说明:标有 DOI 的条目为已发表论文;Levina–Bickel 与 UMAP 原始论文以会议/预印本形式给出;最后一条为软件与数据来源。PBMC3k 数据集由 10x Genomics 公开发布,本文按其原始许可使用。
Citation note: entries with DOIs are published papers; the Levina–Bickel and UMAP papers are cited in their conference/preprint form; the final entry lists software and data sources. The PBMC3k dataset is publicly released by 10x Genomics and used under its original terms.