Code
pak::pkg_install("plotthis")我注意到一个名为 “plotthis” 的新 R 包。该包可以用简单的命令生成达到发表水准的图表,大大简化了 R 的绘图流程。
I noticed a new R package called “plotthis” produced byundefined. This package could generate publication ready plots with simple commands, which largely simplified the R plotting process.
手册:https://jbengler.github.io/tidyplots/
The manual: https://jbengler.github.io/tidyplots/
它基于 ggplot2 体系,同时也很容易按需添加更多功能。
It is based on ggplot2 system, it is also very easy to add more features as we want.
pak::pkg_install("plotthis")开发版本可以通过以下方式安装
The development version could be installed with
pak::pkg_install("pwwang/plotthis")library(plotthis)| p.0.4 | p.0.5 | p.0.6 | p.0.7 | p.0.8 | p.0.9 | p.1 | split |
|---|---|---|---|---|---|---|---|
| B | A | F | G | G | J | Z | 2 |
| D | E | A | H | A | D | I | 1 |
| C | F | G | G | C | H | NA | 2 |
| A | C | B | B | C | E | L | 1 |
| A | E | A | E | H | H | B | 1 |
| A | E | B | B | B | E | T | 2 |
ClustreePlot(data, prefix = "p") + theme_blog_overlay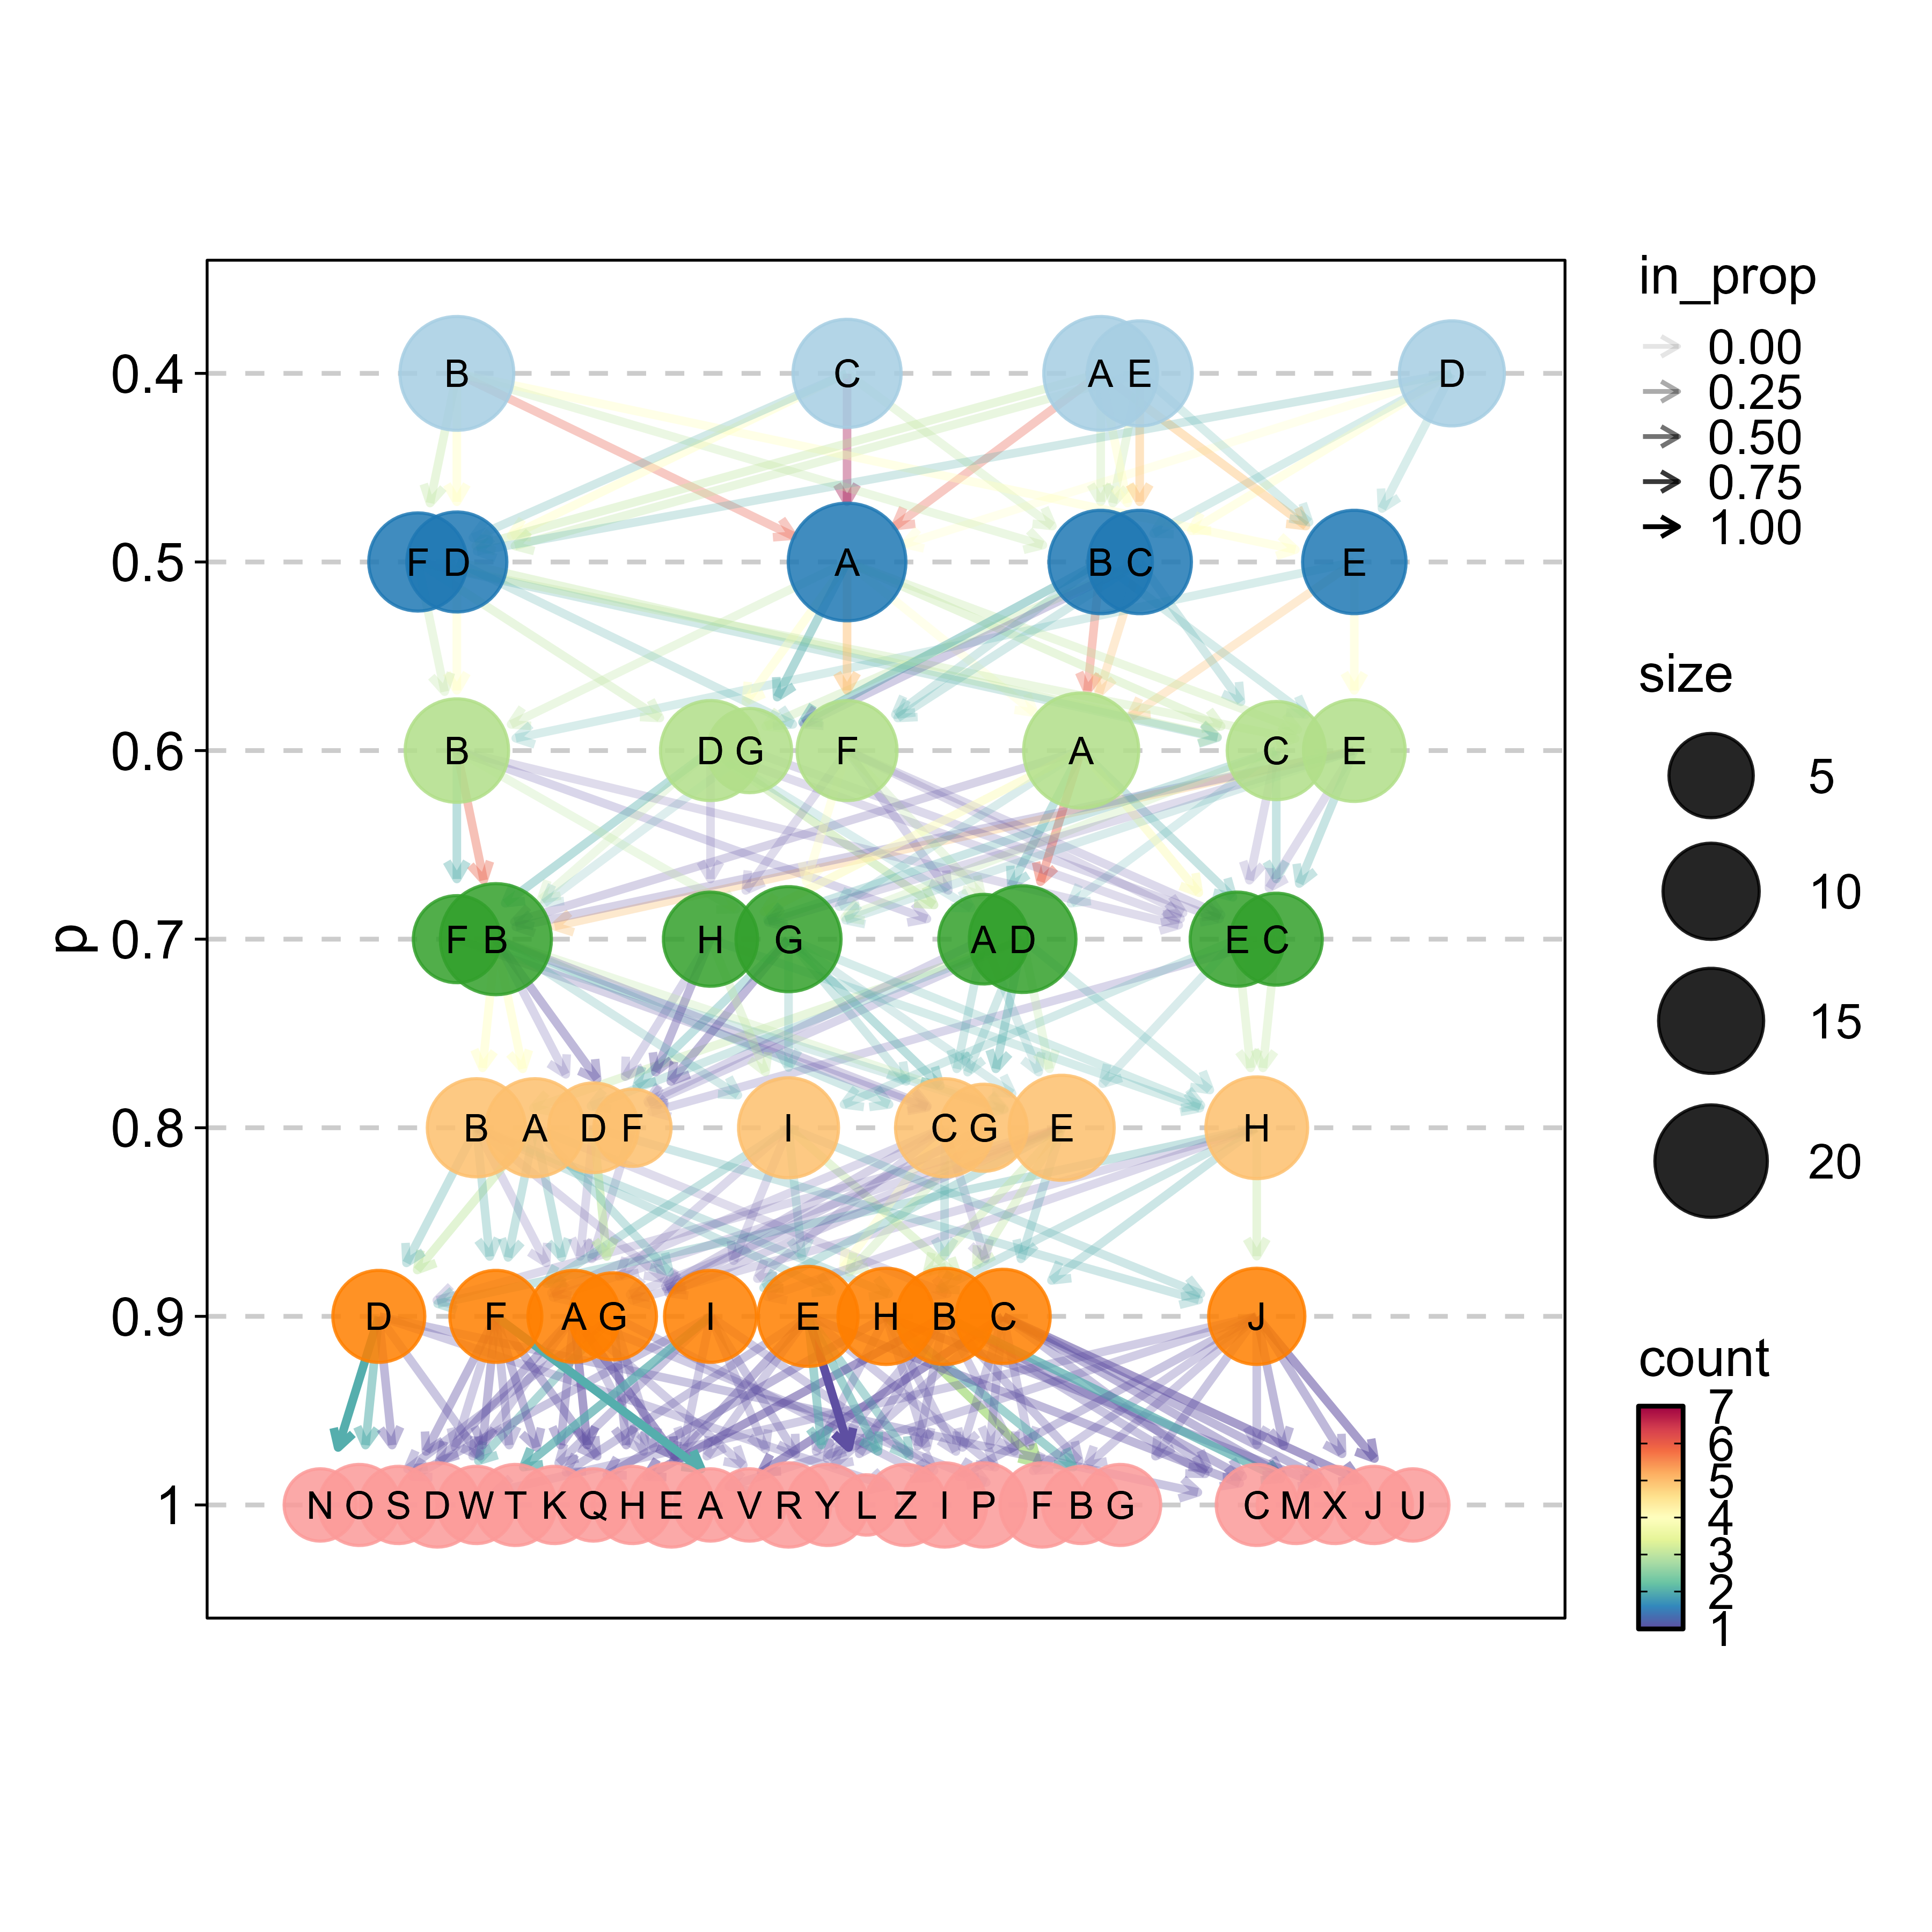
我后来意识到,你可能需要仔细设置图的高度和宽度,因为这个包不会自动适配屏幕尺寸,这是一个小缺点。
I just realized that you might set the height and width of plots carefully, as this package dose not fit the size of your screen automatically, it is a small shortage.
我很喜欢它能够生成的弦图(ChordPlot)和韦恩图(VennDiagram)。
I like the ChordPlot and VennDiagrm it could generate.
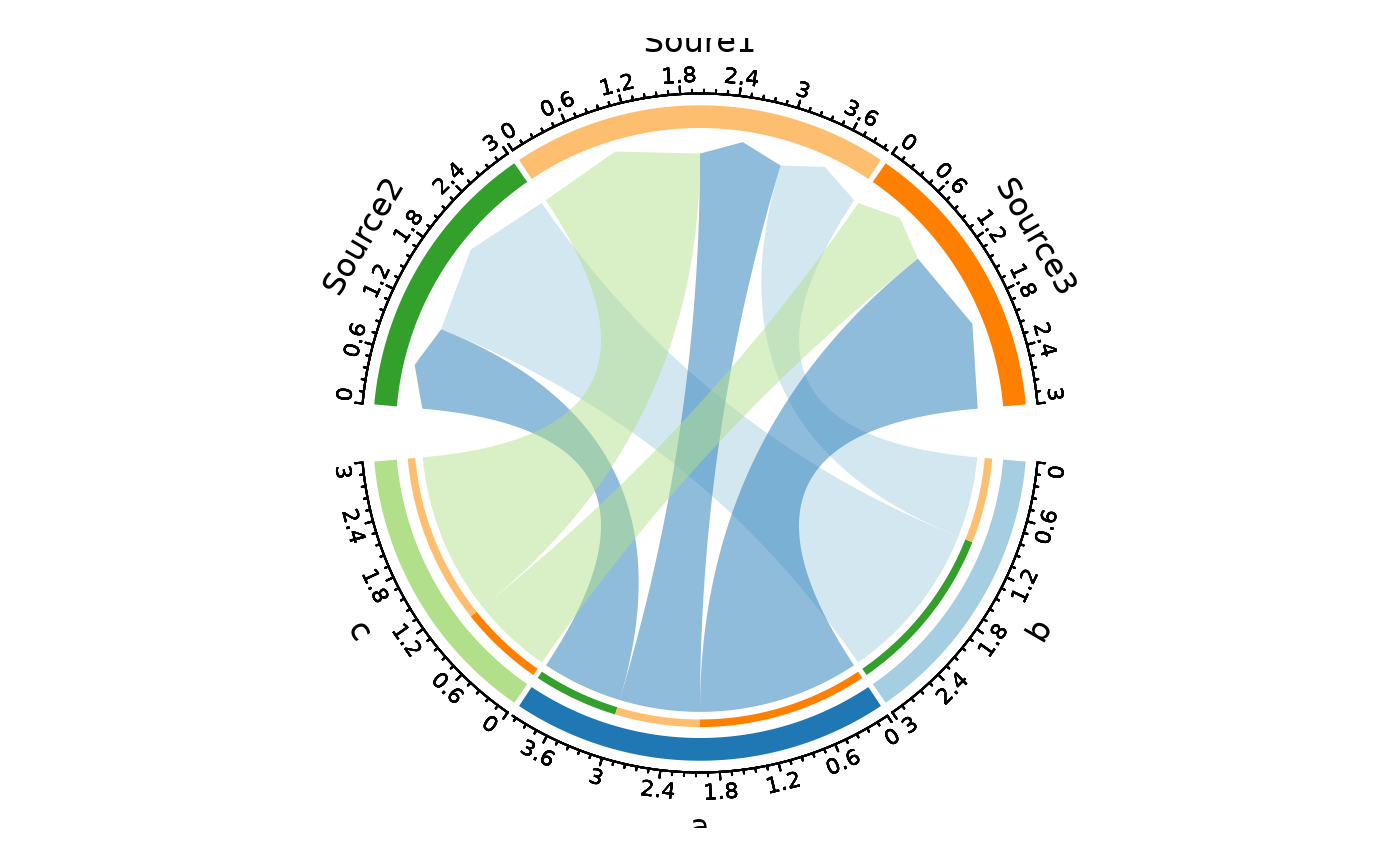
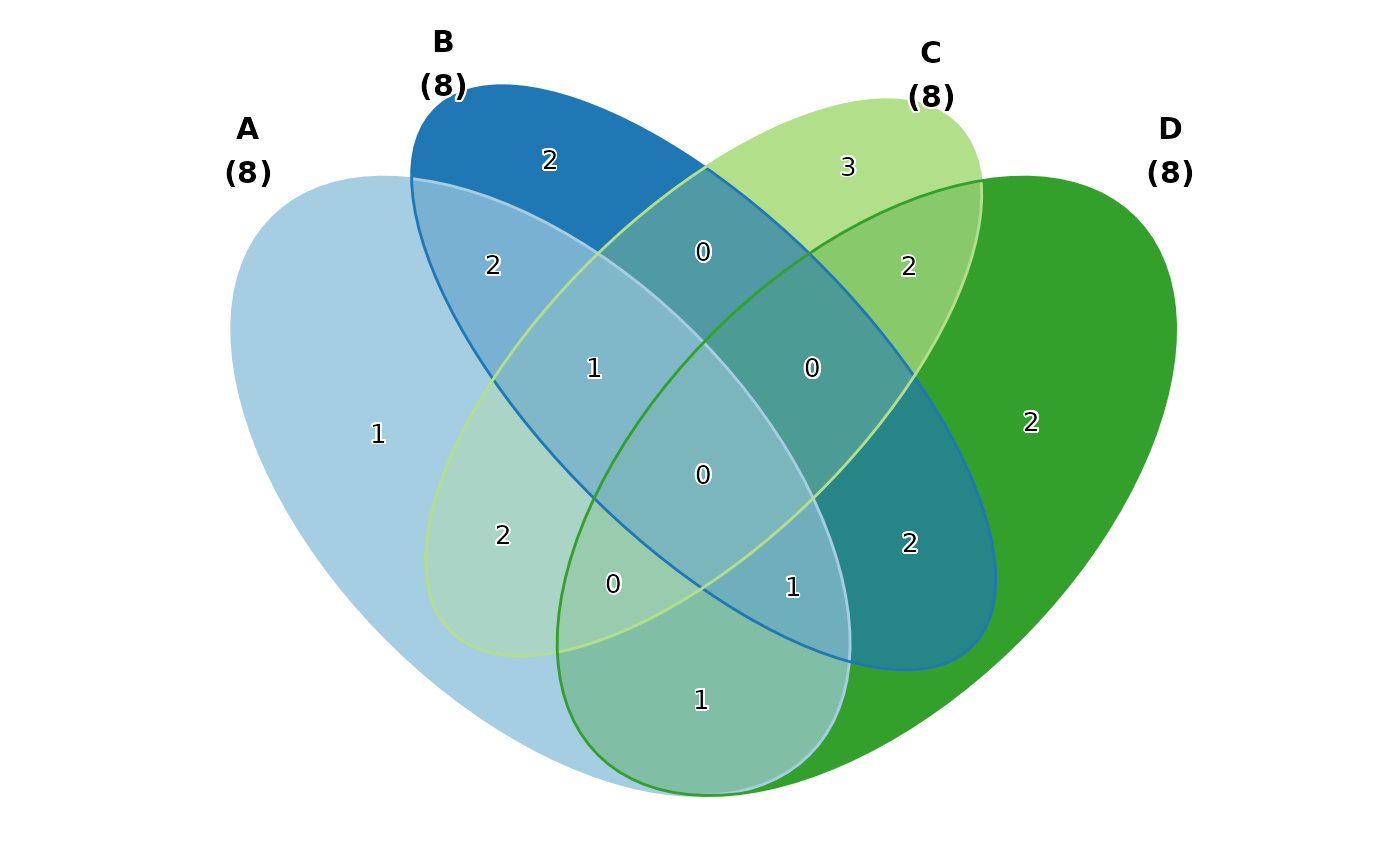
这个包也许对初学者,或对 ggplot2 了解不多的人有所帮助。
This package maybe helpful for beginners or people without much knowledge of ggplot2.