pak::pkg_install("tidyplots")Basic Information
I noticed a new R package called “tidyplots” produced by Jan Broder Engler. This package could generate publication ready plots with simple commands, which largely simplified the R plotting process.
The manual: https://jbengler.github.io/tidyplots/
I had a try and it works very well. I hope there will be more useful functions.
It is based on ggplot2 system, it is also very easy to add more features as we want.
Installation
The development version could be installed with
pak::pkg_install("jbengler/tidyplots")Plotting
library(tidyplots)Barplot
| treatment | group | dose | participant | age | sex | score |
|---|---|---|---|---|---|---|
| A | placebo | high | p01 | 23 | female | 2 |
| A | placebo | high | p02 | 45 | male | 4 |
| A | placebo | high | p03 | 32 | female | 5 |
| A | placebo | high | p04 | 37 | male | 4 |
| A | placebo | high | p05 | 24 | female | 6 |
| B | placebo | low | p06 | 23 | female | 9 |
study |>
  tidyplot(x = treatment, y = score, color = treatment) |>
  add_data_points() |>
  add_mean_bar(alpha = 0.4) |>
  add_sem_errorbar() |>
  adjust_colors(new_colors = colors_discrete_seaside)
Barstack plot
energy |>
  tidyplot(x = year, y = energy, color = energy_source) |>
  add_barstack_absolute()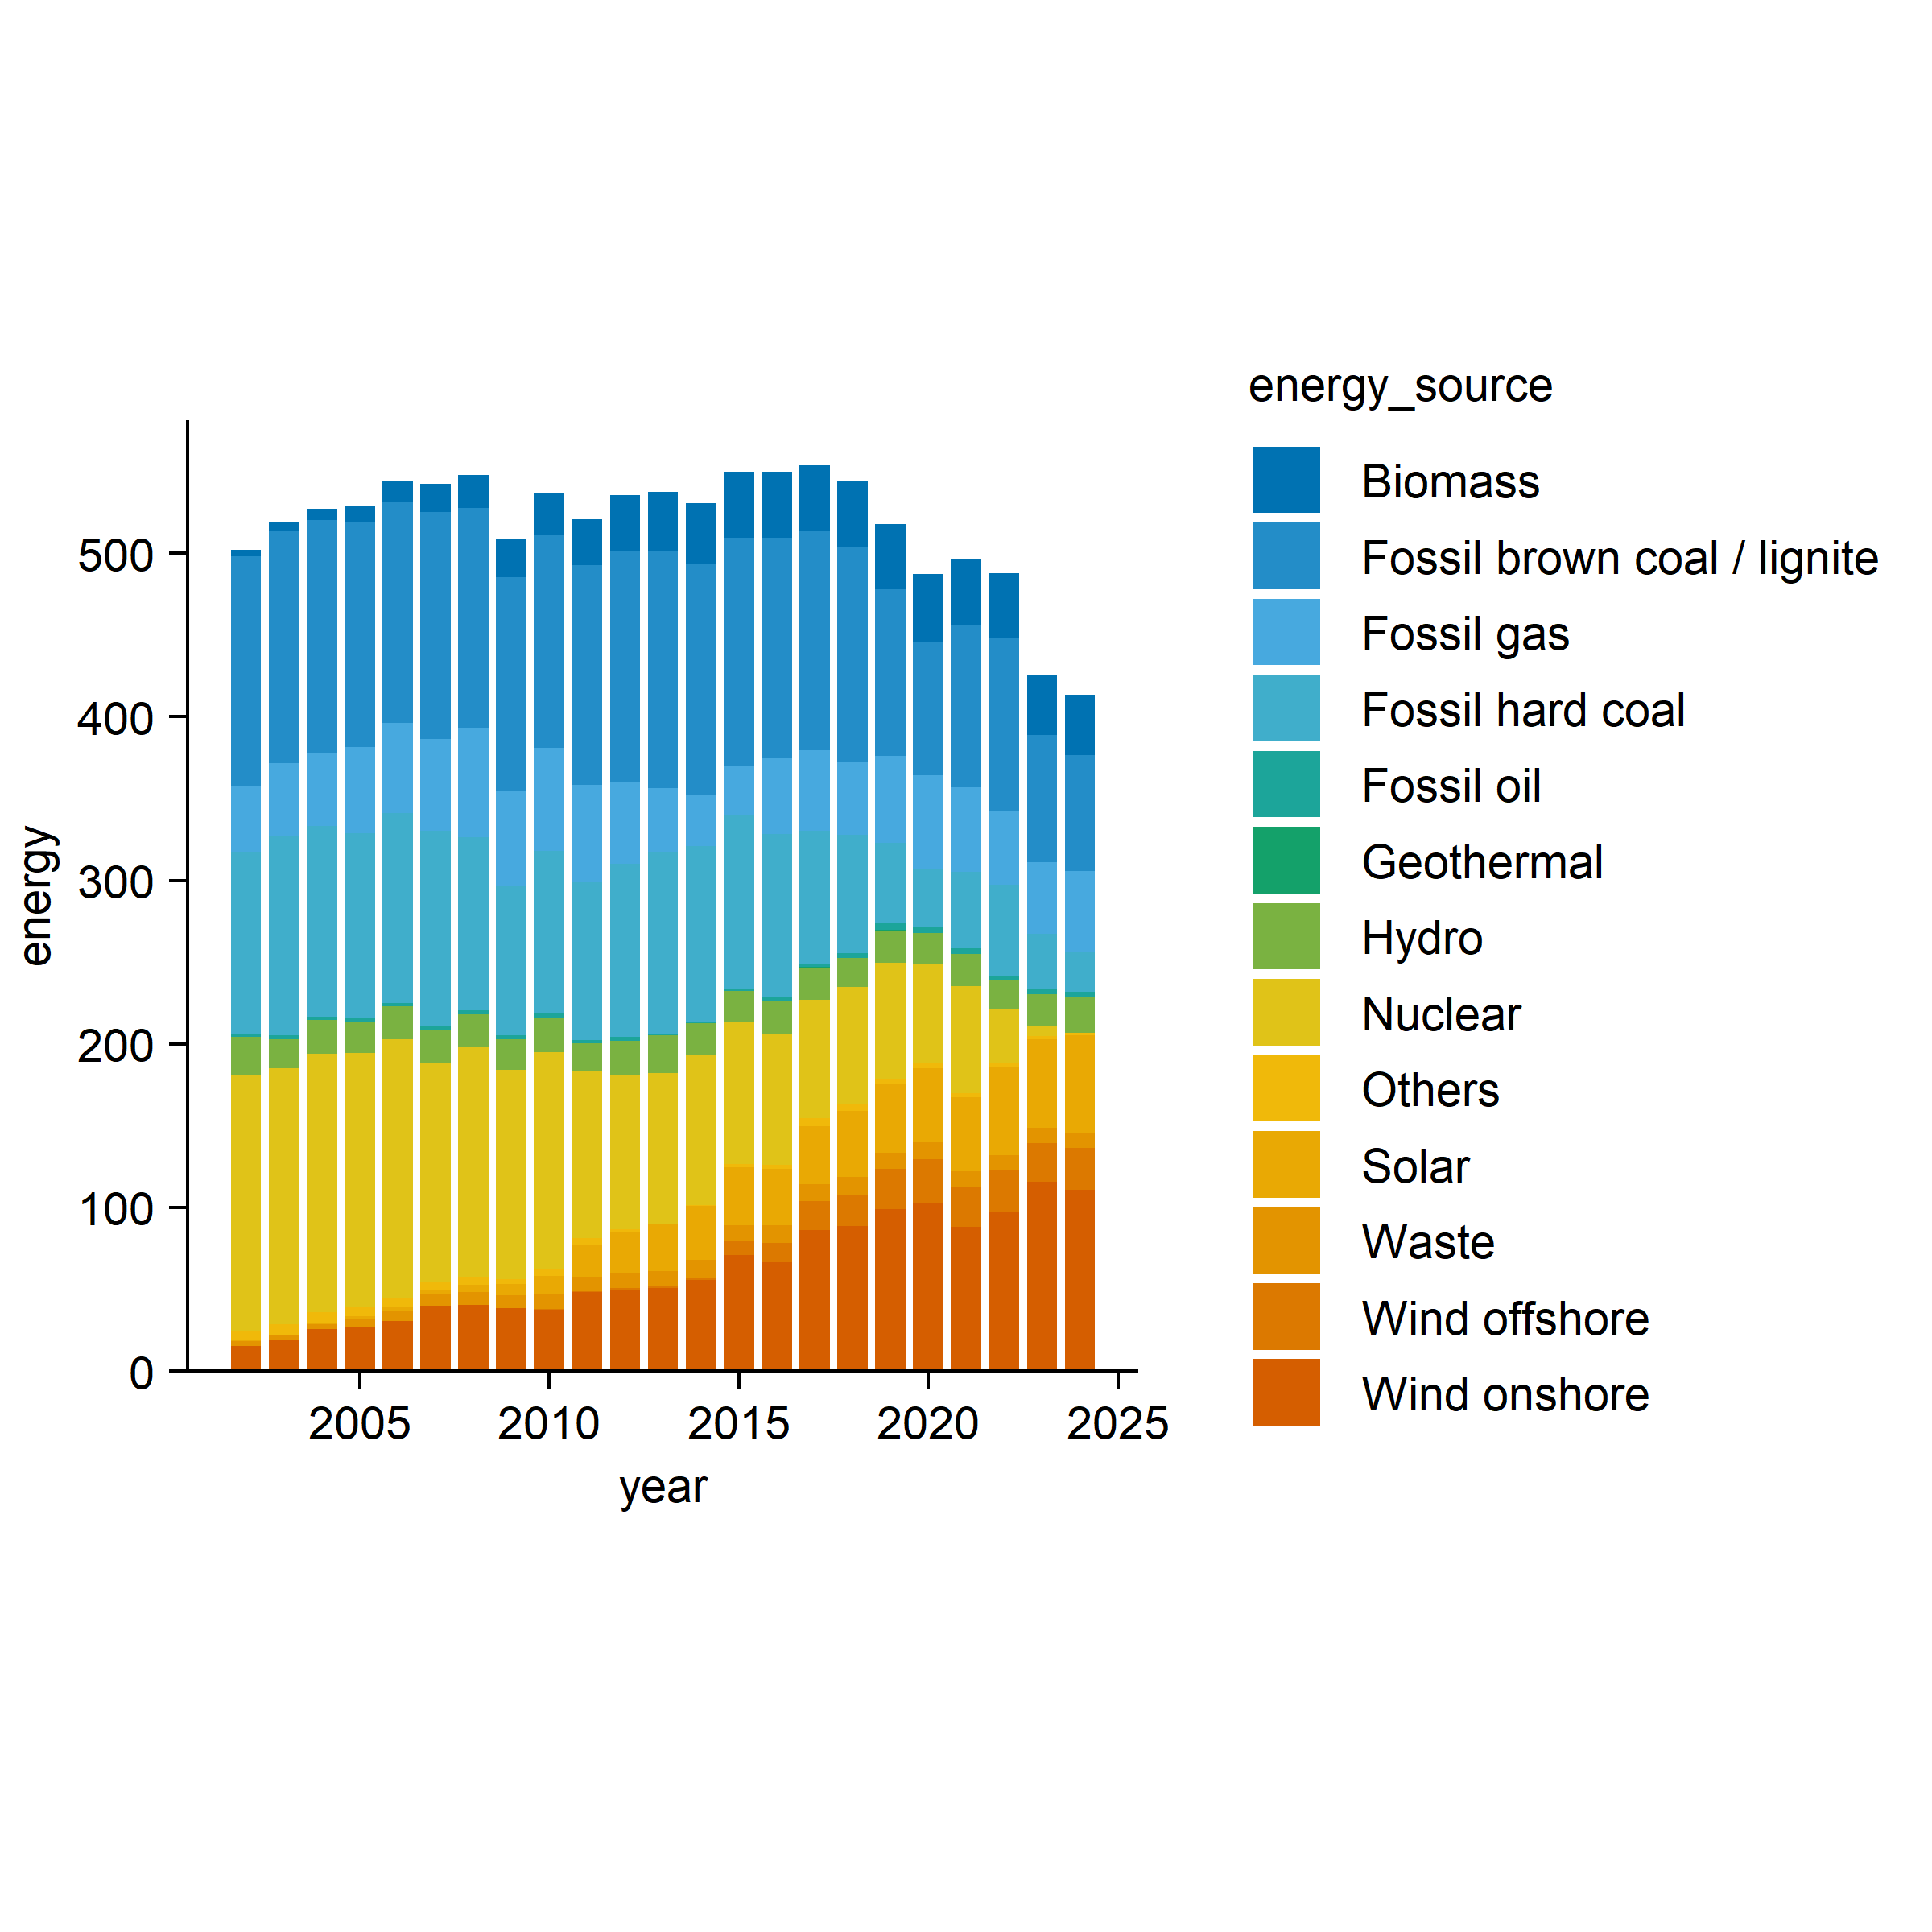
It provided many useful types of plotting function, it is better to go to its official website to learn how to use this package.
Other example
energy |>
  dplyr::filter(year %in% c(2005, 2010, 2015, 2020)) |>
  tidyplot(y = energy, color = energy_source) |>
  add_donut() |>
  adjust_size(width = 25, height = 25) |>
  split_plot(by = year)
✔ split_plot: split into 4 plots across 1 page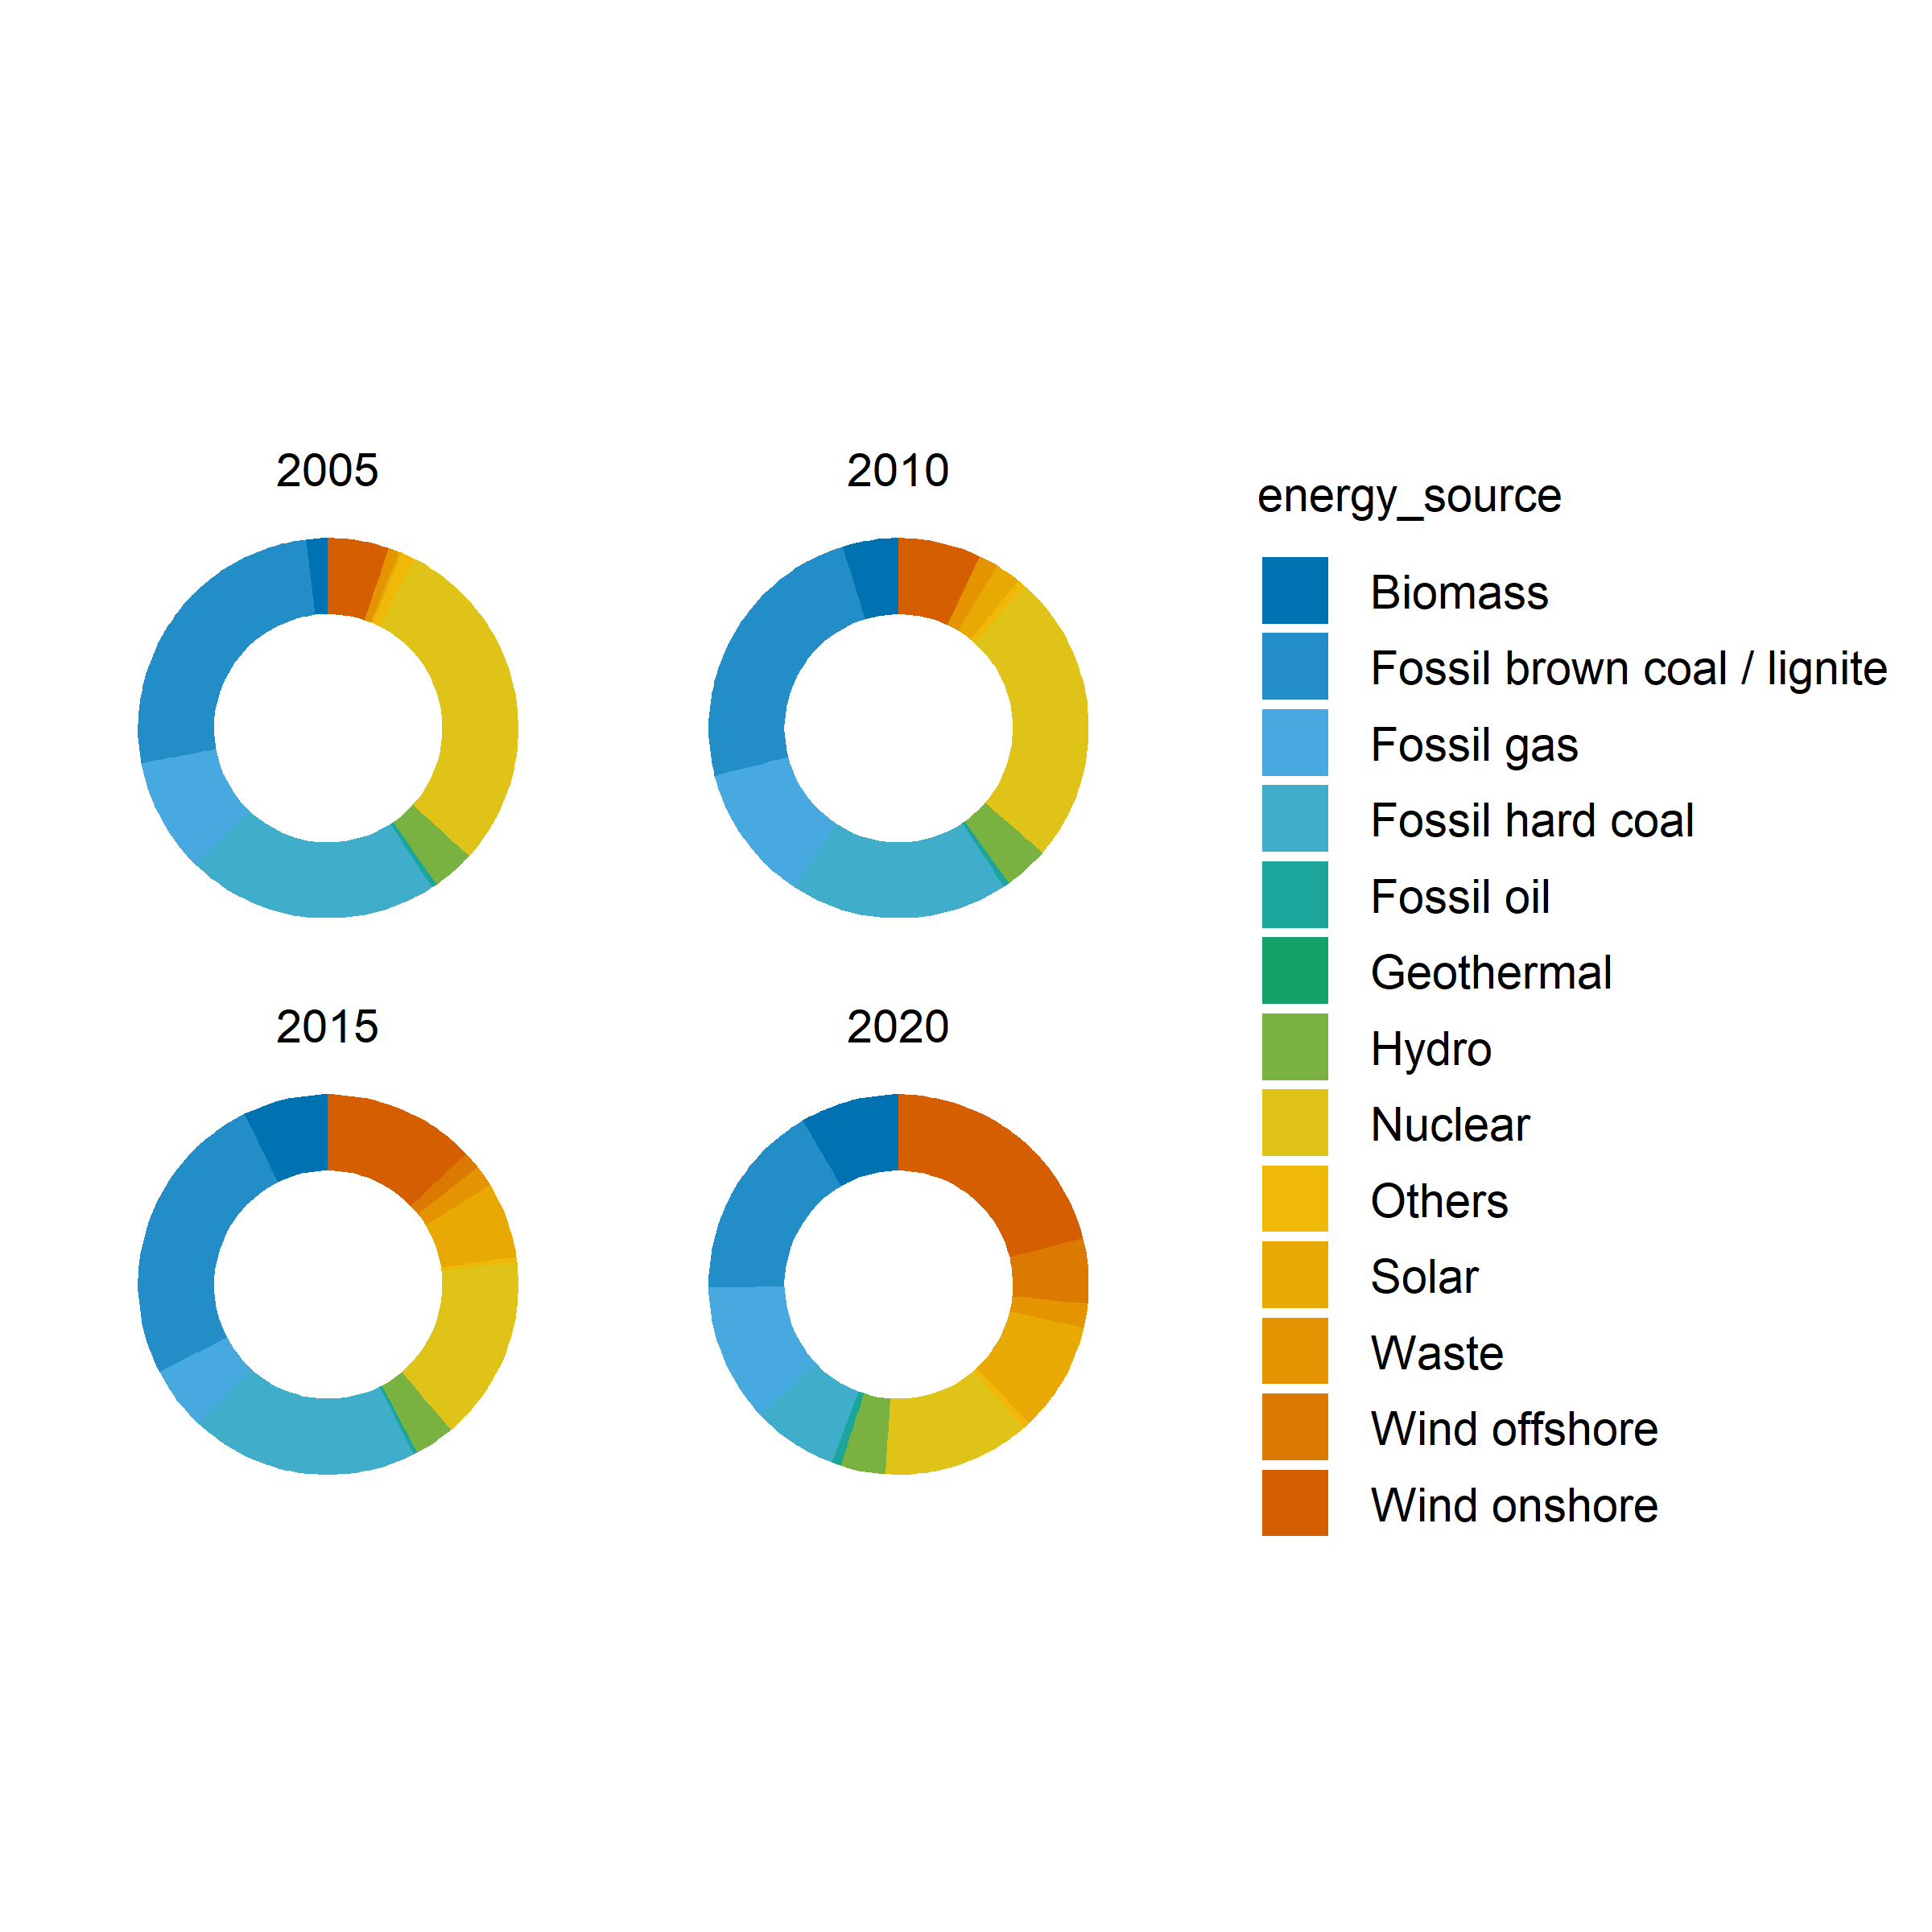
library(tidyverse)Warning: package 'tibble' was built under R version 4.4.2Warning: package 'tidyr' was built under R version 4.4.2Warning: package 'readr' was built under R version 4.4.2Warning: package 'dplyr' was built under R version 4.4.2Warning: package 'stringr' was built under R version 4.4.2Warning: package 'forcats' was built under R version 4.4.2── Attaching core tidyverse packages ──────────────────────── tidyverse 2.0.0 ──
✔ dplyr 1.1.4 ✔ readr 2.1.5
✔ forcats 1.0.0 ✔ stringr 1.5.1
✔ ggplot2 3.5.2 ✔ tibble 3.2.1
✔ lubridate 1.9.4 ✔ tidyr 1.3.1
✔ purrr 1.0.4
── Conflicts ────────────────────────────────────────── tidyverse_conflicts() ──
✖ dplyr::filter() masks stats::filter()
✖ dplyr::lag() masks stats::lag()
ℹ Use the conflicted package (<http://conflicted.r-lib.org/>) to force all conflicts to become errors#library(tidyplots)
df <-
read_csv("https://tidyplots.org/data/correlation-matrix.csv")Rows: 202500 Columns: 5
── Column specification ────────────────────────────────────────────────────────
Delimiter: ","
chr (2): x, y
dbl (3): correlation, order_x, order_y
ℹ Use `spec()` to retrieve the full column specification for this data.
ℹ Specify the column types or set `show_col_types = FALSE` to quiet this message.df |>
tidyplot(x = x, y = y, color = correlation) |>
add_heatmap() |>
sort_x_axis_labels(order_x) |>
sort_y_axis_labels(order_y) |>
remove_x_axis() |>
remove_y_axis() |>
remove_legend_title() |>
adjust_legend_position("right") |>
adjust_colors(colors_continuous_inferno) |>
adjust_theme_details(legend.key.height = unit(1, "null")) |>
add_caption("Data source: Spellman PT, et al. 1998. Mol Biol Cell 9(12): 3273-97.")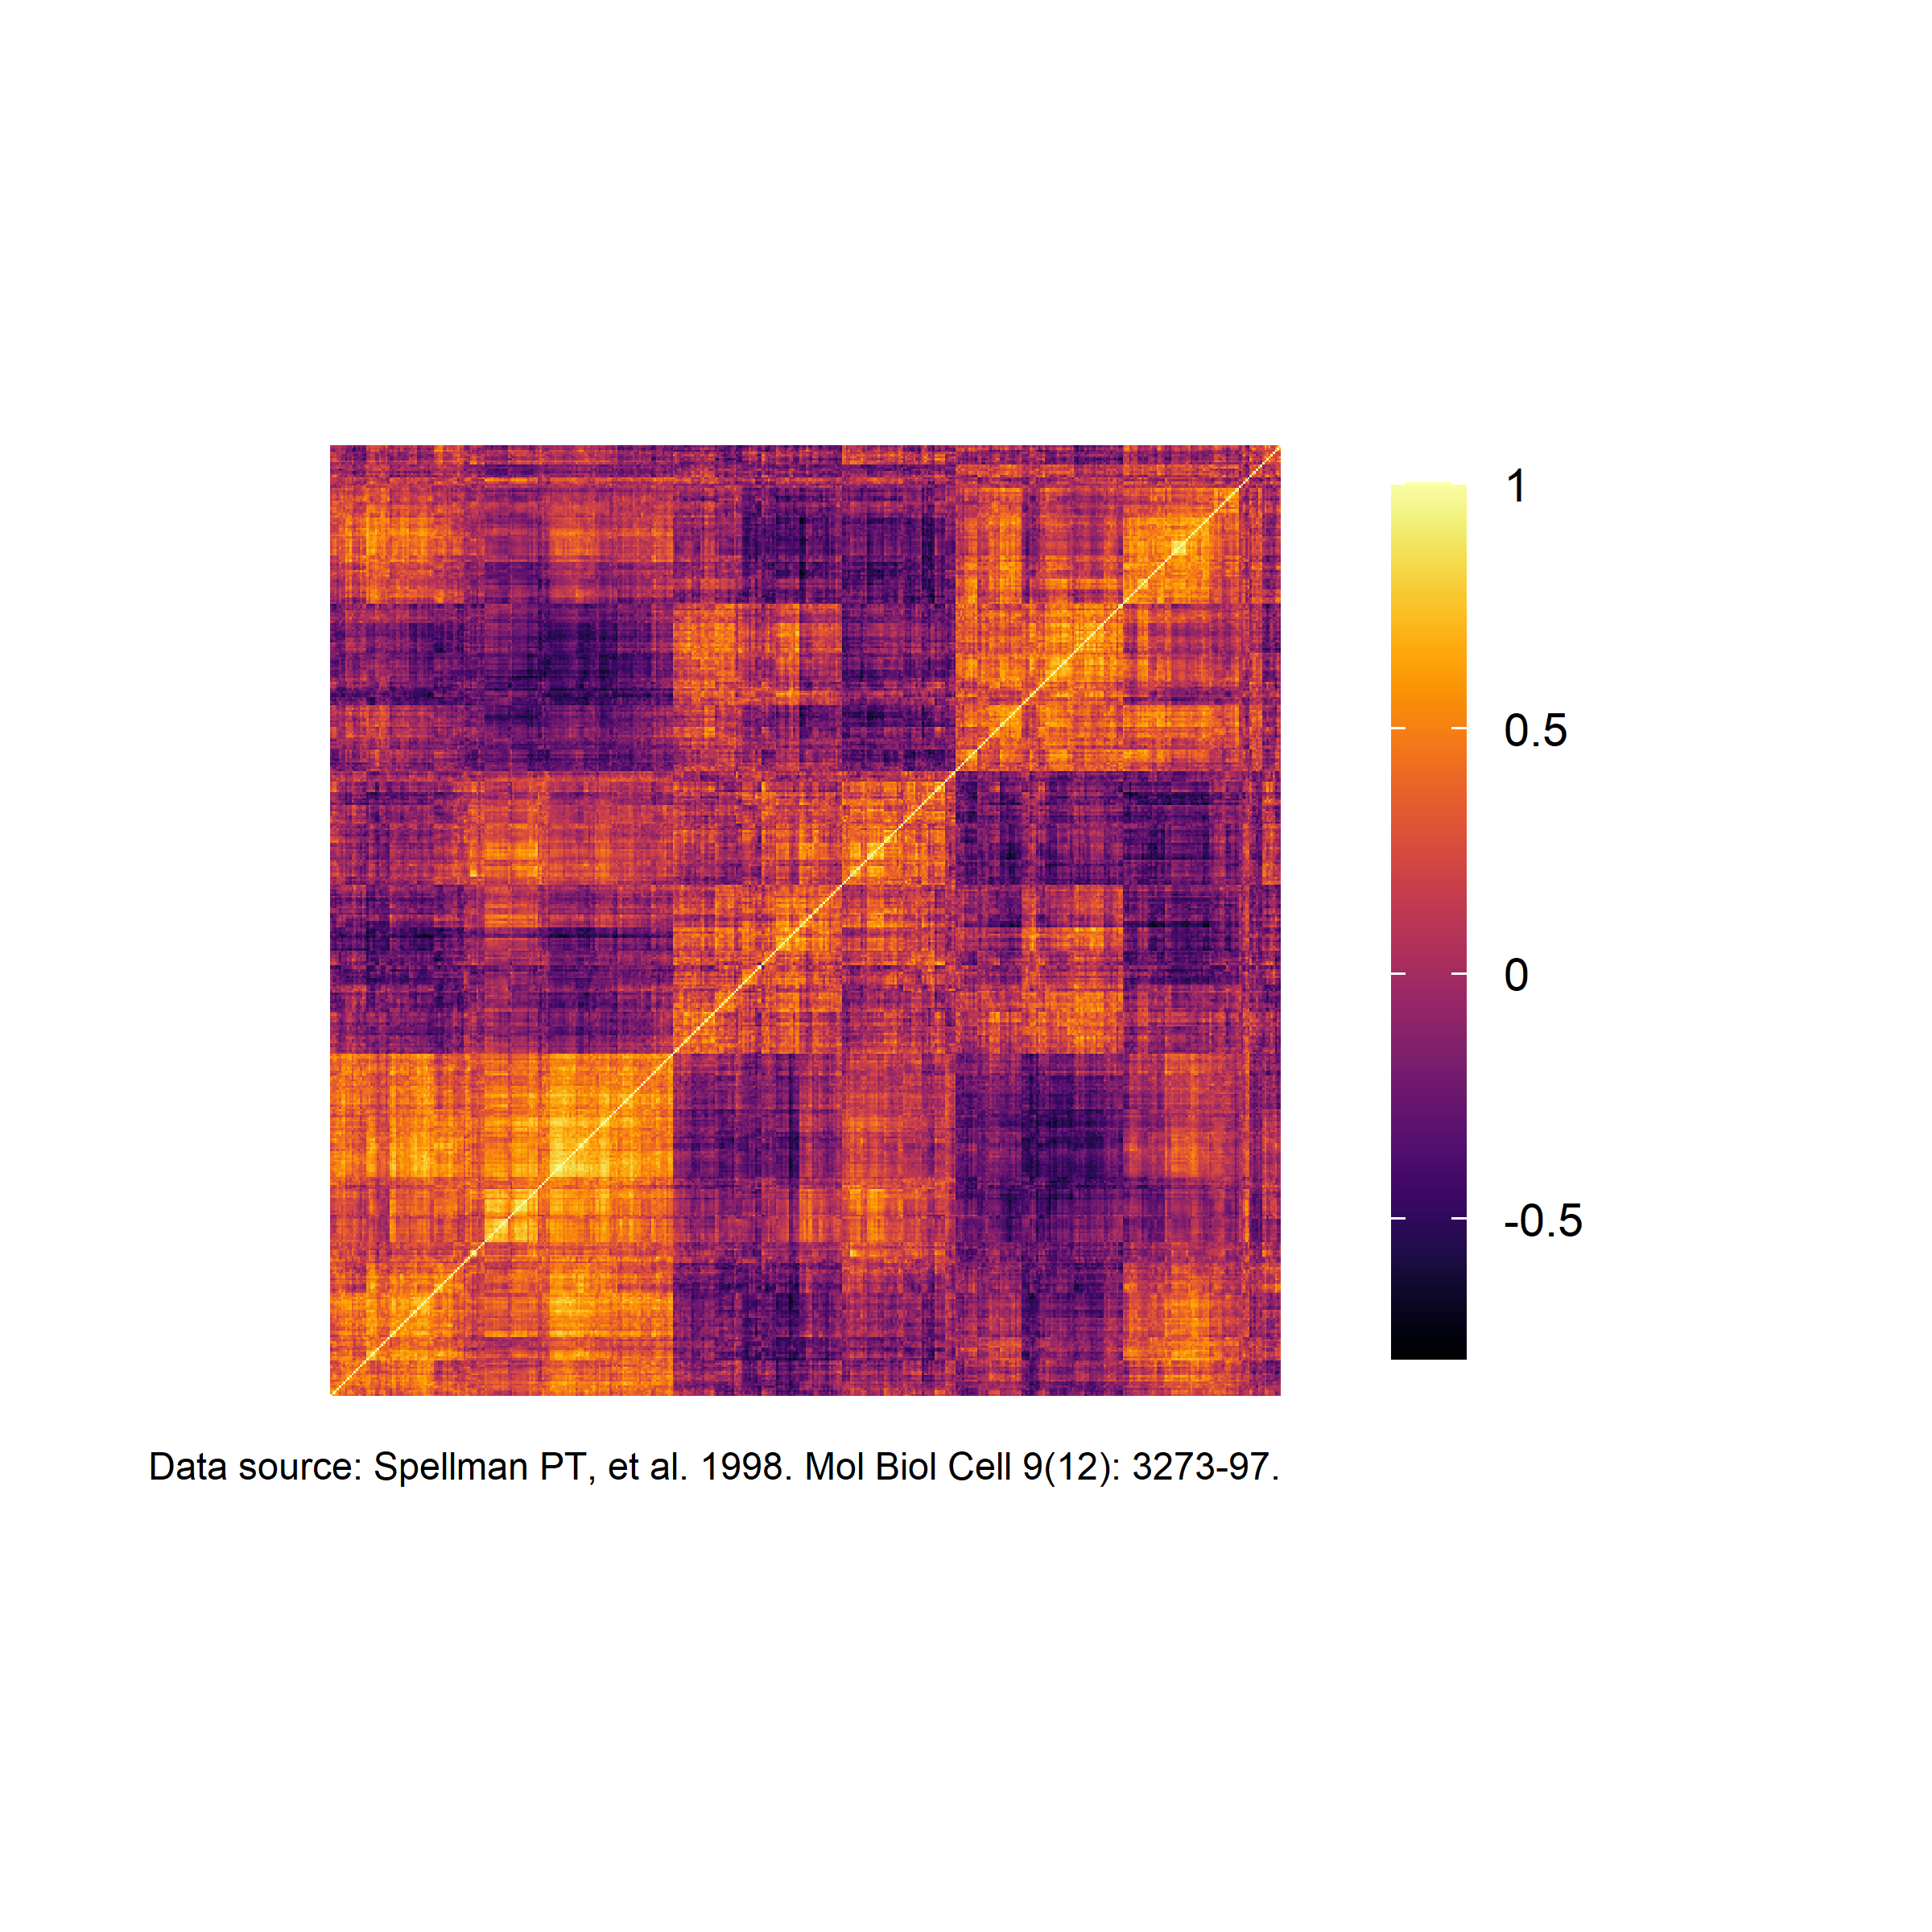
If tidyplots could directly read .mcool or .hic files, it will be very helpful.
I guess it is what he plans to do, we can use other R packages to read the contact matrix files into a dataframe to have a try, but it will take more efforts.